Loading...
Contents
The ChatGPT Prompts I Use for Embedded C Debugging
Jun 30, 202651 min readUpdated Oct 3, 2026
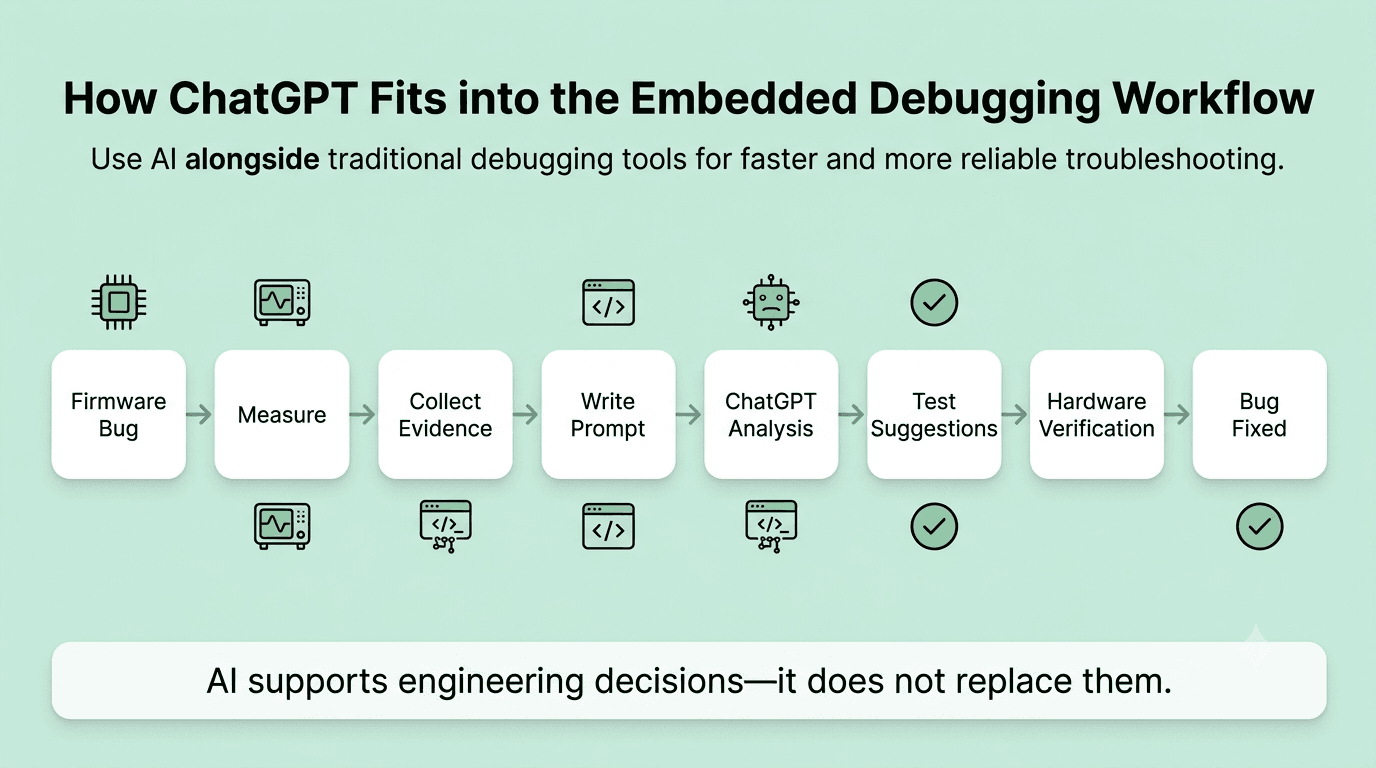
Every embedded engineer eventually runs into a bug that refuses to explain itself. The firmware runs perfectly on your development board, then crashes after two days in the field. UART starts dropping bytes only at 115200 baud. An I2C sensor responds flawlessly on the bench but stops communicating on the production PCB. A FreeRTOS application corrupts memory even though the stack overflow hook never fires. At that point, Stack Overflow rarely has an exact match. The datasheet seems to answer one question while raising three more, and the colleague who usually knows the answer is away on leave. This is where ChatGPT has become one of the most useful tools in my embedded debugging workflow. Not because it replaces debugging skills, but because it helps eliminate the time spent recalling peripheral behaviour, interpreting fault registers, or exploring likely causes. The oscilloscope, debugger, and reference manual still make the final decision. ChatGPT simply helps narrow the search much faster. The difference between getting a generic answer and getting genuinely useful debugging advice usually comes down to one thing: how you write the prompt. In this article, I'll share the exact prompt templates I use for common Embedded C debugging scenarios, why they work, and where you should still verify everything yourself.
FREE TO USE
25K+ INTERVIEWS4.8★ RATING68% IMPROVEMENT
Crack Your Dream Job
Real Interviews. Real Pressure. Practice until it feels easy.
- Seamless Interview Experience
- Resume & JD Questions
- Instant Personalized Feedback
Why Most Firmware Engineers Don't Get Good Results from AI
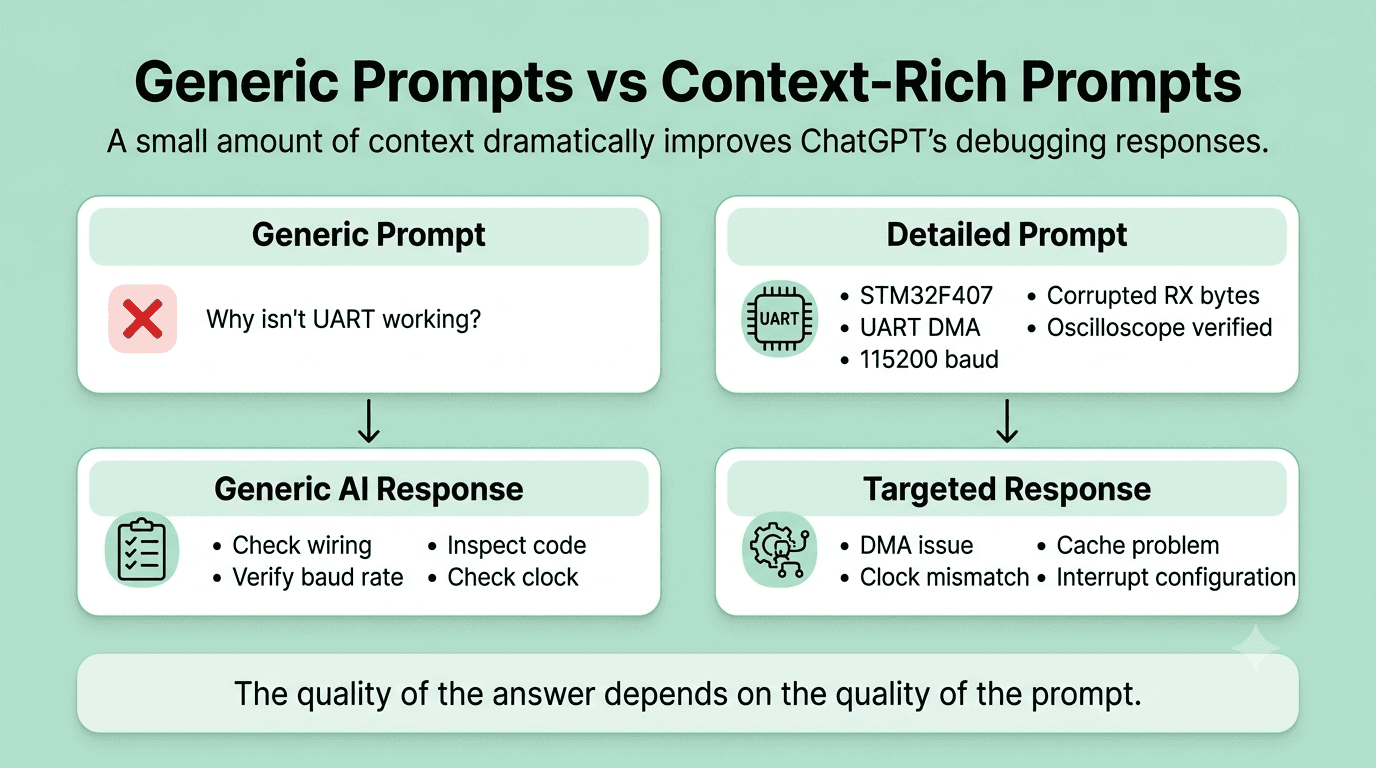
Many firmware engineers try ChatGPT once or twice, receive a vague answer, and decide AI isn't useful for embedded development. Most of the time, the problem isn't the model—it's the prompt. Embedded systems are incredibly context-dependent. A question like: "Why isn't my UART working?" is almost impossible to answer. Is it an STM32 or an NXP microcontroller? Are you using interrupts or DMA? Is the peripheral clock configured correctly? Does the baud rate match on both ends? What does the logic analyser show? Is the problem occurring during transmission, reception, or both? Without that context, even a senior firmware engineer would have to guess. The biggest mindset shift is moving from keyword thinking to context thinking. Instead of searching for isolated keywords, describe the problem exactly as you would when asking an experienced teammate for help. Include the hardware, the software configuration, what you've already tested, and what you're observing. Once you start doing that, the quality of ChatGPT's responses improves dramatically.
How to Use ChatGPT for Embedded C Debugging
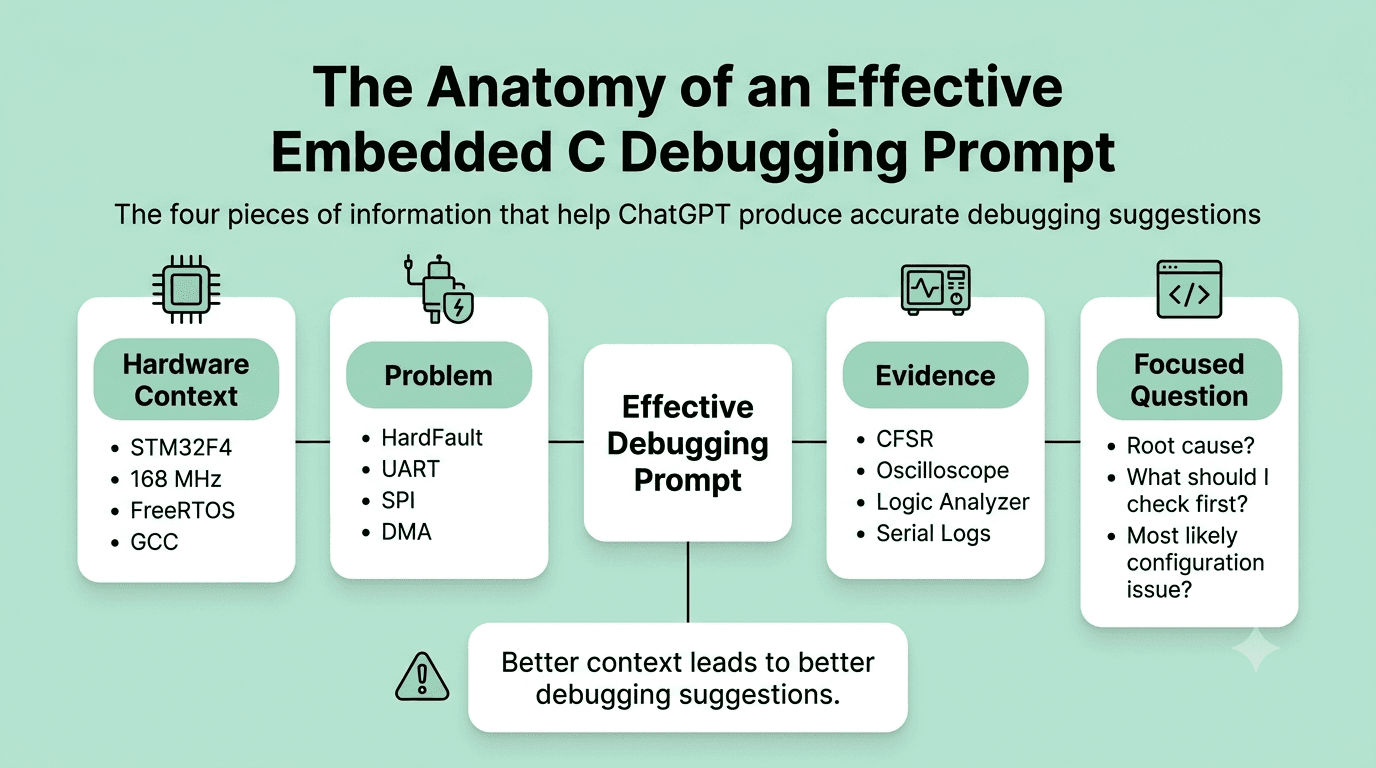
Regardless of the problem you're solving, I try to include the same three pieces of information in every debugging prompt. Mention the microcontroller family, development environment, clock configuration (when relevant), and the peripheral involved. For example: STM32F407 running at 168 MHz GCC with STM32CubeIDE FreeRTOS 10.4.6 UART using DMA The more specific the hardware context, the fewer assumptions ChatGPT has to make. Avoid saying: "It doesn't work." Instead, explain what you're seeing and what you expected to happen. For example: UART transmits correctly but receives corrupted bytes. DMA buffer occasionally contains 0xFFFF values. HardFault appears after approximately two hours of runtime. Interrupt latency varies between 4.2 µs and 8.7 µs. Measurements from an oscilloscope, logic analyser, or debugger make prompts significantly more useful because they eliminate obvious possibilities. Paste only the code related to the issue. This could be: Peripheral initialisation Register configuration HAL function calls ISR implementation FreeRTOS task creation Linker configuration (when applicable) Finally, explain what you've already ruled out. That prevents ChatGPT from suggesting steps you've already completed and encourages it to reason about less obvious causes. Let's look at how this works in real debugging scenarios.1. Hardware Context
2. Exact Symptom
3. Relevant Code or Configuration
The Best ChatGPT Prompts for Firmware Development
Prompt 1: HardFault Debugging
HardFaults are frustrating because the place where execution stops is often not where the actual bug originated. A corrupted pointer, stack overwrite, or invalid memory access may occur much earlier, making systematic debugging essential. I am getting a HardFault on an STM32F4 running at 168MHz with FreeRTOS. The fault occurs during normal task execution, not at startup. The CFSR register reads: 0x00010000 (UNALIGNED bit set in UsageFault). Here is the function where the fault appears to originate based on the call stack: [paste your function here] What are the most likely causes of an unaligned access HardFault in this context? Which data types or operations should I check first? This prompt immediately gives ChatGPT enough context to narrow the possibilities. Instead of listing every possible HardFault cause, it can focus on issues that commonly produce an unaligned UsageFault on an ARM Cortex-M4 running FreeRTOS, such as: Misaligned structure access Packed structures Pointer casting DMA buffer alignment Compiler optimisation side effects Including the CFSR value is especially valuable because it points directly toward a specific fault category instead of treating every HardFault the same. Always confirm register definitions using your device's reference manual. Although CFSR bit assignments are standard across Cortex-M processors, interpretation can vary depending on your MCU family, silicon revision, and memory configuration.Prompt Template
Why This Prompt Produces Better Answers
What to Verify Yourself
Prompt 2: FreeRTOS Stack Overflow and Heap Issues
Memory corruption is one of the most time-consuming problems in embedded development because the crash usually happens long after the code that caused it. A corrupted heap, overwritten stack, or invalid pointer may remain hidden for several minutes before the application finally fails. I am running FreeRTOS 10.4.6 on an STM32H7 with configCHECK_FOR_STACK_OVERFLOW set to 2. I have three tasks: - Sensor task: 4 KB stack - Display task: 8 KB stack - Communication task: 6 KB stack The heap is configured at 64 KB using heap_4. The application runs for 30 to 60 minutes before crashing with a corrupted heap. The stack overflow hook is never called. Here is my task creation code: [paste task creation code] What patterns in FreeRTOS configurations commonly cause heap corruption without triggering the stack overflow hook? What should I instrument first? Notice how much information this prompt provides before asking a question. It tells ChatGPT: the FreeRTOS version, the MCU family, the heap implementation, task stack sizes, runtime before failure, and, most importantly, that the stack overflow hook never executes. That final detail rules out many straightforward stack overflow scenarios and shifts the discussion toward issues like: writing past dynamically allocated buffers, heap fragmentation, invalid pointer usage, double-free bugs, or memory corruption caused by DMA. Instead of receiving generic FreeRTOS advice, you're much more likely to get suggestions that match the actual behaviour you're observing. Use runtime measurements alongside ChatGPT's suggestions. Functions such as uxTaskGetStackHighWaterMark() and heap monitoring utilities can help confirm whether the issue is genuinely stack-related or whether another component is corrupting memory long before the crash occurs.Prompt Template
Why the Extra Context Matters
What to Verify Yourself
Prompt 3: Peripheral Initialisation Issues
A surprising amount of embedded debugging comes down to peripheral configuration. Whether it's SPI, UART, I2C, timers, or ADCs, a single incorrect setting can make a peripheral appear completely dead. Even worse, the symptoms are often silent—no crashes, no error messages, just hardware that doesn't behave the way you expect. The more information you can provide about what you've already verified, the more useful ChatGPT's suggestions become. I am configuring SPI1 on an STM32L4 in master mode at 1MHz. I am using HAL_SPI_TransmitReceive in polling mode. The MISO line is always reading 0xFF regardless of what the slave sends. My SPI initialisation: [paste your hspi1 configuration code] The slave device is a 25AA256 EEPROM. CS is controlled manually via GPIO. I have verified with an oscilloscope that: - CLK is toggling correctly - MOSI is sending the correct bytes - CS goes low before the transaction and high after - MISO appears to stay high What are the most common causes of MISO reading 0xFF when CLK and MOSI are confirmed correct? Is there a phase or polarity mismatch pattern I should check? Notice that you've already eliminated several obvious possibilities. By mentioning your oscilloscope observations, ChatGPT no longer has to suggest checking whether the clock is running or whether chip select is toggling correctly. Instead, it can focus on more realistic causes, such as: CPOL/CPHA mismatch Incorrect MISO pull-up or pull-down configuration Slave device not leaving high-impedance mode Chip-select timing requirements SPI frame size mismatch Incorrect GPIO alternate function settings That saves time because the discussion starts where your own debugging has already reached. AI can suggest likely causes, but always confirm them against the peripheral timing diagrams in the datasheet. Many communication issues come down to subtle timing requirements that differ between devices, even when they use the same protocol.Prompt Template
Why This Prompt Gets Better Results
What to Verify Yourself
Prompt 4: DMA Transfer Corruption
DMA bugs are some of the hardest problems to diagnose because they often involve timing, memory alignment, and cache behaviour rather than incorrect application logic. The frustrating part is that they rarely fail consistently. A transfer might work hundreds of times before corrupted data suddenly appears. I am using DMA1 on an STM32H7 to transfer ADC data to a buffer in SRAM. The DMA is configured in circular mode with double buffer enabled. I am processing the buffer in the half-complete and complete callbacks. Occasionally, roughly 1 in 500 transfers, the processed data contains values that do not correspond to any valid ADC reading (values like 0xCDCD or 0xFFFF). The STM32H7 has an L1 cache. My buffer is declared as: uint16_t adcBuffer[2048]; What cache coherency issues should I investigate for this scenario? What changes to the buffer declaration or cache management would you recommend checking first? This prompt immediately tells ChatGPT something important. You're using an STM32H7, which includes an L1 data cache. That changes the discussion entirely because cache coherency becomes a realistic suspect. Rather than offering generic DMA advice, ChatGPT can explain issues such as: CPU reading cached data instead of freshly transferred DMA data Missing cache clean or invalidate operations Buffer alignment requirements Placing DMA buffers in non-cacheable memory MPU configuration for DMA regions Those are much more relevant than generic suggestions about checking interrupt priorities or enabling DMA clocks. Whenever DMA interacts with cached memory, validate the solution using your MCU's reference manual and application notes. Cache maintenance operations differ between microcontroller families, so never assume recommendations apply universally.Prompt Template
Why the Details Matter
What to Verify Yourself
FREE TO USE
8k+ SESSIONS92% FLUENCY4.9★ RATING
Speak With Confidence
Real Conversations. Real Scenarios. Speak until it feels natural.
- Real-Time Speaking Practice
- Guided Conversation Flows
- Instant AI Feedback
Prompt 5: Timing and Interrupt Latency Issues
Real-time firmware often isn't limited by functionality—it's limited by timing. If an interrupt occasionally exceeds its deadline, the root cause is rarely obvious. It may involve interrupt priorities, RTOS scheduling, cache behaviour, or another peripheral temporarily blocking execution. Measured timing data gives ChatGPT far more useful context than simply saying an interrupt is "too slow." I have a time-critical interrupt handler on an STM32F7 that must complete within 5 microseconds at 216MHz. The handler reads a GPIO pin state, updates a counter, and sets another GPIO. With a logic analyser I measure the handler takes 4.2 to 8.7 microseconds with significant variance. The variance appears correlated with whether a FreeRTOS task switch happens near the interrupt. Here is the interrupt handler: [paste handler code] What causes interrupt latency variance in this pattern? What should I check in my NVIC priority configuration and FreeRTOS interrupt masking settings? Instead of asking why the interrupt is slow, you've supplied measurements. You've also pointed out an important observation—that latency seems to increase around task switches. That gives ChatGPT enough context to discuss topics like: NVIC priority configuration configMAX_SYSCALL_INTERRUPT_PRIORITY FreeRTOS critical sections Interrupt masking Cache and branch prediction effects ISR execution time Instead of guessing, the model can reason from the evidence you've already collected. Whenever timing is critical, trust measurements over assumptions. Use a logic analyser, GPIO toggling, or the Cortex-M DWT cycle counter to verify execution time after every optimisation.Prompt Template
Why This Prompt Works Well
What to Verify Yourself
A General-Purpose Debugging Prompt Template
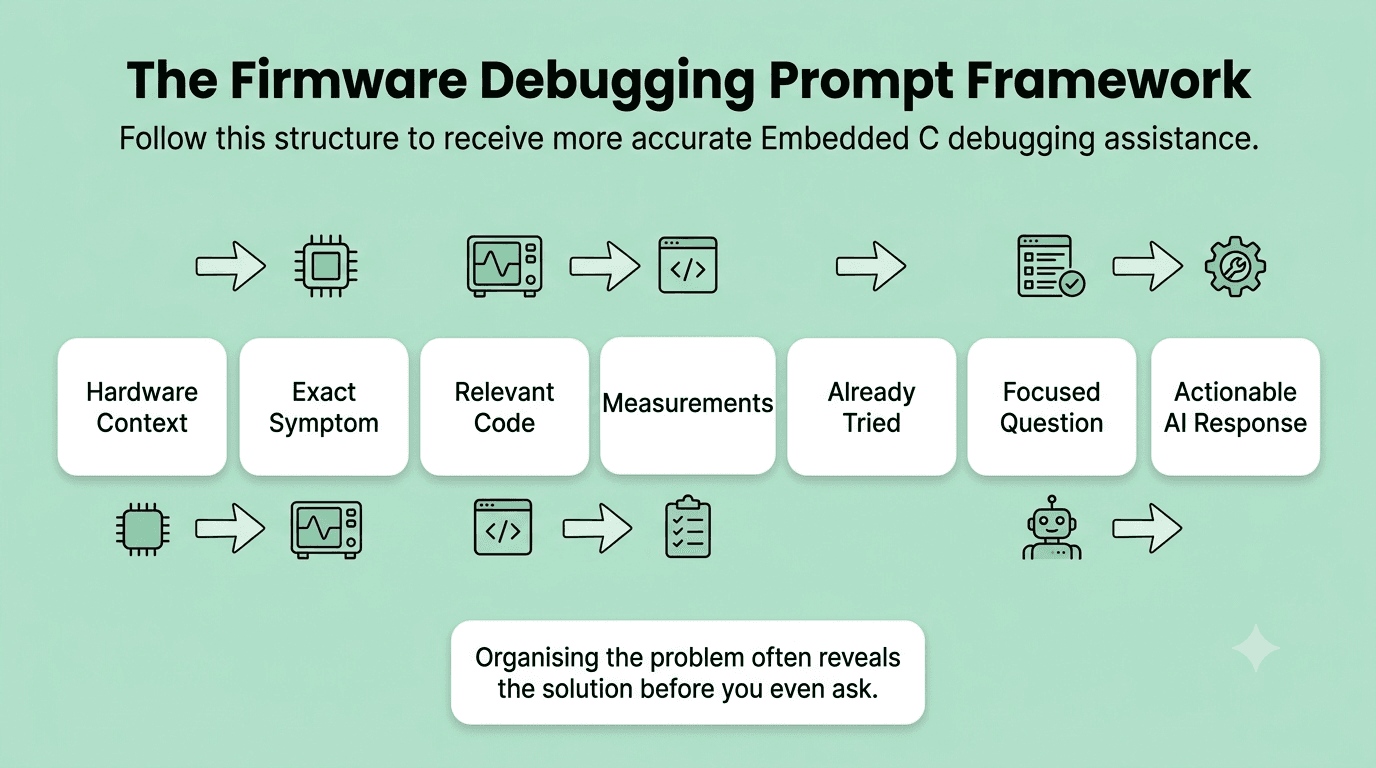
If you only remember one thing from this article, remember this structure. It works for almost every Embedded C debugging scenario. Context - MCU: - Toolchain: - RTOS or Bare Metal: - Peripheral involved: Symptom Describe exactly what is happening. Explain what you expected to happen instead. Include oscilloscope, debugger, logic analyser or serial output if available. Relevant Code Paste only the configuration and code related to the issue. What I've Already Tried List everything you've already ruled out. Specific Question Ask one focused question rather than "What is wrong?" This structure does something useful before ChatGPT even responds—it forces you to organise your own debugging process. Many engineers discover missing assumptions simply by writing a complete prompt.
Good Debugging Prompt Checklist
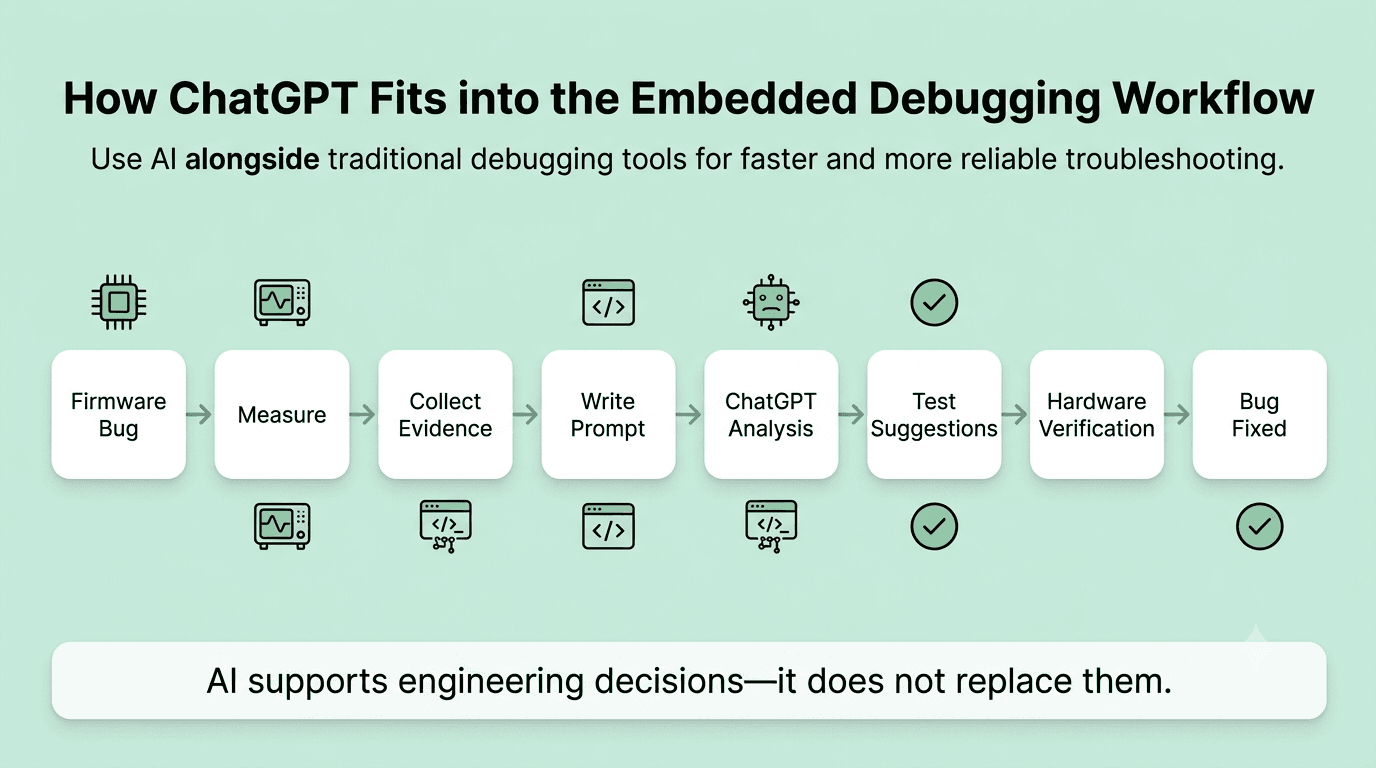
Before sending a debugging prompt to ChatGPT, make sure you've included: The more complete the context, the more focused and practical the response tends to be.
Weak Prompts vs Better Prompts
, A small change in wording can completely change the quality of the answer you receive. The difference isn't the AI model, it's the amount of useful context you've provided.
Where to Be Careful With AI for Embedded Systems Development
ChatGPT can save a significant amount of debugging time, but it shouldn't become your only source of truth. Embedded systems interact directly with hardware, and small mistakes can lead to problems that are difficult to diagnose. AI is excellent at narrowing down possibilities and explaining concepts, but final verification should always come from your own testing and the official documentation. Here are the areas where I apply extra scrutiny. AI tools occasionally suggest incorrect register names, bit positions, or mask values. Even if the explanation sounds convincing, verify every register write against your microcontroller's reference manual before changing production code. A single incorrect bit can completely change peripheral behaviour. If you're working on firmware for medical devices, automotive systems, industrial controls, or any safety-certified application, AI-generated code should never be accepted without a thorough engineering review. Standards such as IEC 62304, ISO 26262, and IEC 61508 require traceability, validation, and documented verification. AI can help explain concepts or review logic, but it doesn't replace those requirements. ChatGPT can explain why an interrupt might be slower than expected or suggest ways to reduce latency, but it cannot tell you how many clock cycles your compiler generated. Always validate timing using: Logic analyser measurements GPIO pin toggling The Cortex-M DWT cycle counter Your compiler's generated assembly When you're trying to meet a strict real-time deadline, measured results always matter more than theoretical estimates. Startup files and linker scripts define how your firmware is built before main() even executes. A small mistake in memory placement, interrupt vectors, or section mapping can create failures that are extremely difficult to trace later. AI is useful for understanding these files and explaining what each section does. However, avoid generating an entire linker script or startup file from scratch unless you review every line carefully.Register-Level Details
Safety-Critical Applications
Timing-Critical Code
Linker Scripts and Startup Code

Quick Reference: Prompts by Debugging Category
The table below summarises the most effective information to include for common Embedded C debugging scenarios. Use this as a checklist whenever you're writing a debugging prompt. Including the right context upfront almost always leads to better answers.
Common Mistakes When Prompting ChatGPT for Firmware Debugging
Before wrapping up, here are a few mistakes I still see engineers make when using AI for embedded development. Instead of: "Why isn't my SPI working?" Try: "SPI1 on an STM32L4 sends the correct clock and MOSI data, but MISO always remains high when communicating with a 25AA256 EEPROM. What should I investigate first?" The second question gives enough context for meaningful reasoning. Uploading hundreds of source files rarely produces better results. Instead, include only: the relevant peripheral configuration, the code around the failure, and the exact symptom you're seeing. Focused prompts almost always receive more focused answers. If you already have data from an oscilloscope, logic analyser, debugger, or serial output, include it. Measured evidence helps eliminate incorrect assumptions and allows ChatGPT to reason from facts instead of guesses. One of the biggest mistakes is assuming that a confident answer is always a correct one. Use ChatGPT as a debugging partner—not as a replacement for the reference manual, datasheet, or hardware testing.Asking Broad Questions
Pasting an Entire Project
Ignoring Hardware Measurements
Treating AI as the Final Authority
Conclusion
The best firmware engineers don't use ChatGPT to replace debugging, they use it to eliminate the repetitive parts of debugging. Instead of spending half an hour searching forum posts, comparing reference manual sections, or trying to remember an obscure FreeRTOS configuration option, you can use a well-written prompt to narrow the list of likely causes within minutes. The quality of the answer, however, depends almost entirely on the quality of the question. Include the hardware, describe the symptom precisely, share the relevant code, explain what you've already tried, and ask one focused question. That's the same information you'd give an experienced colleague, and it's exactly what helps ChatGPT produce useful debugging advice. At the end of the day, your oscilloscope, debugger, logic analyser, and reference manual still make the final decision. AI simply helps you get there faster. When used this way, ChatGPT becomes more than a code generator. It becomes a practical troubleshooting assistant that helps you spend less time recalling information and more time solving the engineering problem in front of you.
FAQs
More Blogs



Sep 30, 2026
React Developer Interview Preparation Guide: A Complete Roadmap for 2026
31 min read
