Loading...
Contents
Top 50+ DevOps Engineer Interview Questions
Sep 4, 202687 min readUpdated Oct 22, 2026
A Comprehensive Preparation Guide
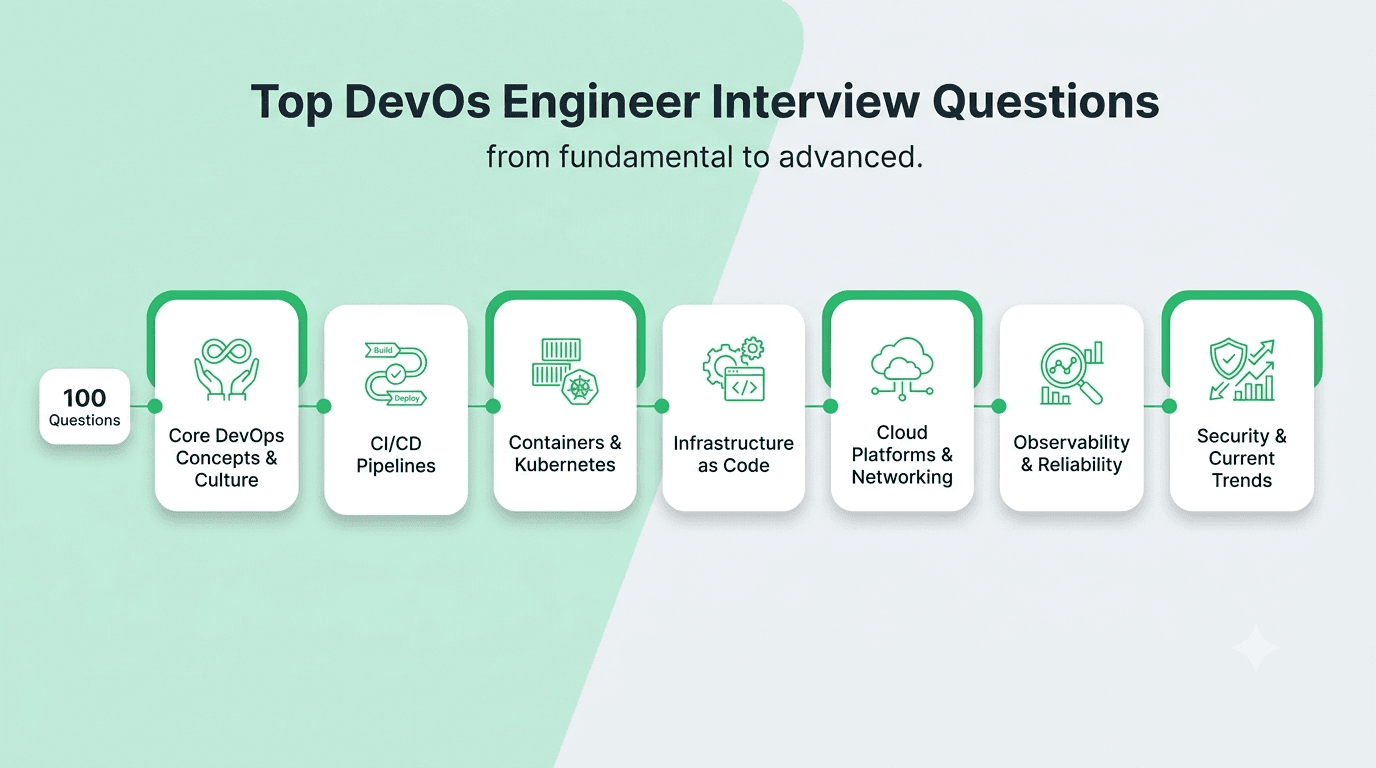
This guide covers the 100 most important DevOps engineer interview questions, organized by topic and roughly ordered by frequency/importance within each category, moving from culture and CI/CD fundamentals through containerization, infrastructure as code, cloud platforms, observability, security, and current industry trends.
Categories:
- Core DevOps Concepts & Culture (Q1-10)
- CI/CD Pipelines (Q11-25)
- Containerization & Orchestration (Q26-45)
- Infrastructure as Code (Q46-58)
- Cloud Platforms & Networking (Q59-70)
FREE TO USE
25K+ INTERVIEWS4.8★ RATING68% IMPROVEMENT
Crack Your Dream Job
Real Interviews. Real Pressure. Practice until it feels easy.
- Seamless Interview Experience
- Resume & JD Questions
- Instant Personalized Feedback
Part 1: Core DevOps Concepts & Culture
1 / 2
Question 1
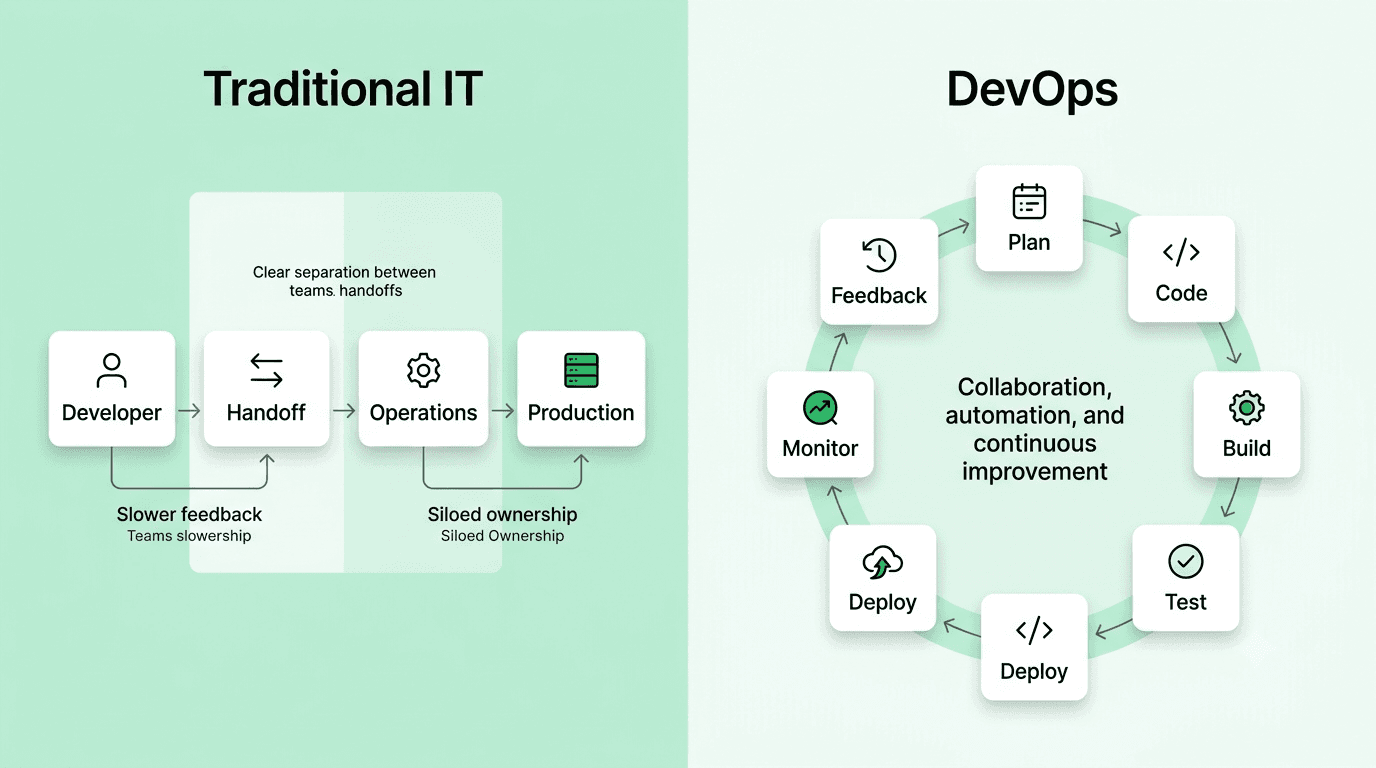
Question: What is DevOps, and how does it differ from traditional IT operations and software delivery models?
Answer: DevOps is a set of cultural practices, tooling, and organizational structure that unifies software development and IT operations to enable faster, more reliable software delivery — replacing the traditional model of separate, siloed dev and ops teams handing off work sequentially (often with friction and finger-pointing) with shared ownership, automation, and continuous feedback loops across the full software lifecycle.
Explanation: A foundational, almost universally asked opening question, testing whether a candidate understands DevOps as a cultural and organizational shift rather than merely a specific toolset or job title.
Real-World Example: A traditional model where developers "throw code over the wall" to a separate ops team for deployment, only discovering problems days later, contrasts with a DevOps model where the same team that writes the code also owns its deployment and production monitoring, catching and fixing issues within minutes.
Common Mistakes: Defining DevOps purely as "a set of tools" (Docker, Kubernetes, Jenkins) without mentioning the underlying cultural shift toward shared ownership and collaboration that those tools are meant to enable.
Follow-up Questions: What specific cultural changes are hardest for an organization to adopt when moving to DevOps? How do you measure whether a DevOps transformation is actually succeeding? What's the relationship between DevOps and Agile methodology?
Question 2
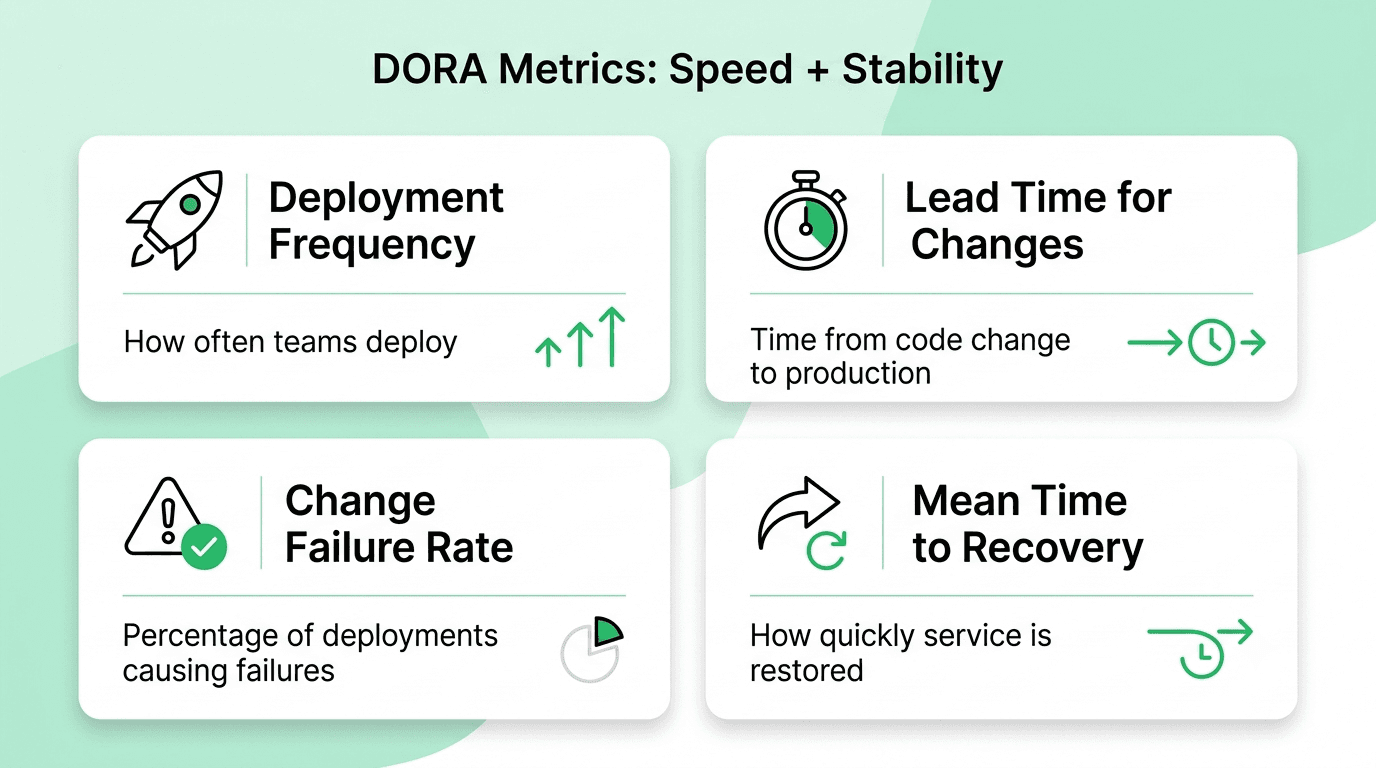
Question: What are the key metrics (like the DORA metrics) used to measure DevOps performance?
Answer: The four DORA (DevOps Research and Assessment) metrics are: Deployment Frequency (how often code is deployed to production), Lead Time for Changes (time from code commit to production deployment), Change Failure Rate (percentage of deployments causing a production failure), and Mean Time to Restore/Recovery (how quickly service is restored after an incident) — together these balance delivery speed against stability.
Explanation: A very commonly tested, foundational metrics question, since DORA metrics have become the de facto industry standard for objectively measuring DevOps maturity.
Real-World Example: An elite-performing team might deploy multiple times per day with a lead time measured in hours, a change failure rate under 15%, and a mean time to recovery under an hour, while a lower-performing team might deploy monthly with lead times measured in weeks.
Common Mistakes: Optimizing for deployment frequency alone without tracking change failure rate, potentially incentivizing risky, poorly-tested deployments that look good on one metric while actually degrading reliability.
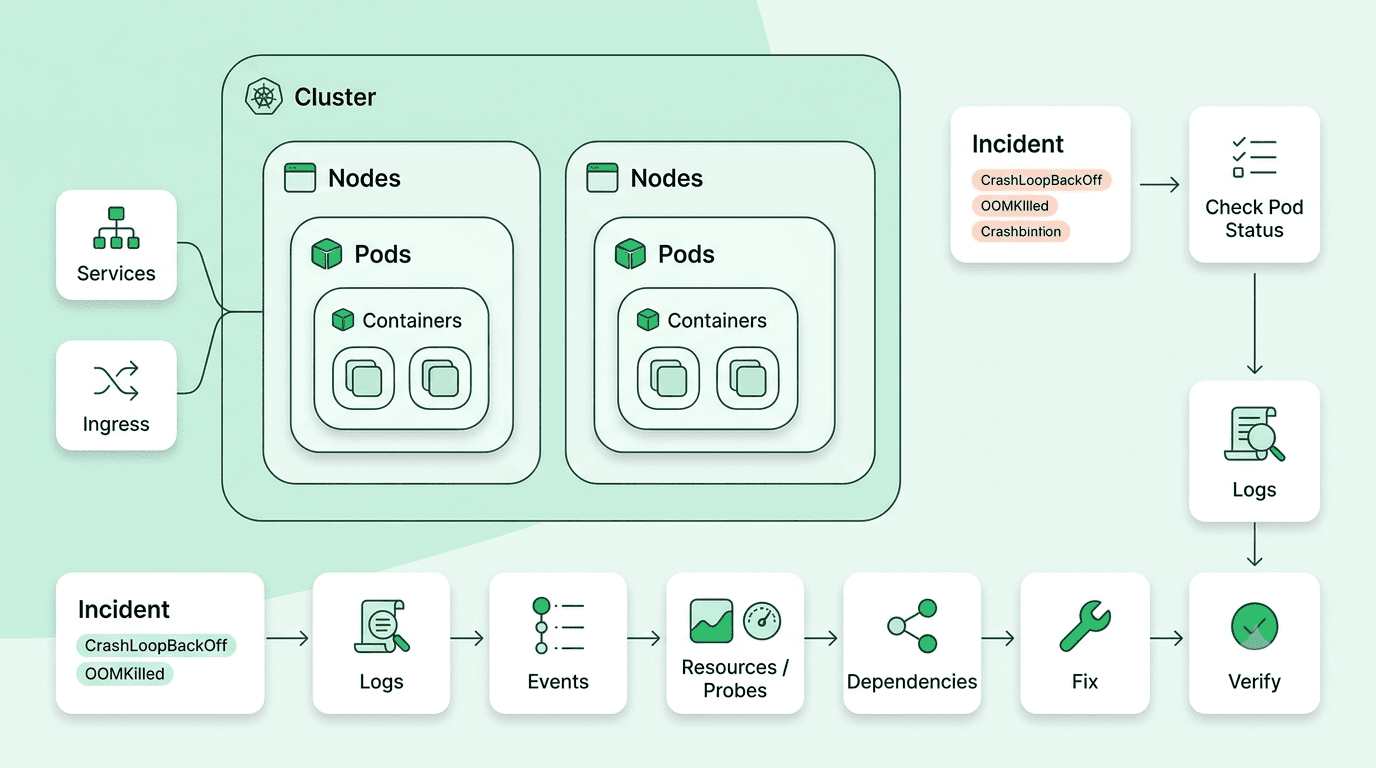
Follow-up Questions: How would you use these four metrics together to diagnose where a team's DevOps practice needs improvement? How would you actually instrument a pipeline to capture these metrics automatically? Why do DORA metrics deliberately balance speed metrics against a stability metric?
Question 3
Question: What is the difference between Continuous Integration, Continuous Delivery, and Continuous Deployment?
Answer: Continuous Integration (CI) automatically builds and tests code on every commit to catch integration issues early. Continuous Delivery extends this by automatically preparing every validated change for release, with a manual approval gate before actual production deployment. Continuous Deployment goes one step further, automatically deploying every change that passes all automated checks straight to production with no manual gate at all.
Explanation: One of the most fundamental and consistently tested DevOps vocabulary questions, since the distinction between Delivery and Deployment specifically is very frequently confused.
Real-World Example: A financial services company might use Continuous Delivery (automated up to a manual release approval, for regulatory/compliance reasons), while a consumer web company with strong automated test coverage might use full Continuous Deployment, releasing dozens of times per day with zero manual gates.
Common Mistakes: Using "Continuous Delivery" and "Continuous Deployment" interchangeably, missing the key distinction of whether a manual approval gate exists before production release.
Follow-up Questions: What would need to be true about a team's test coverage and monitoring before they could safely adopt full Continuous Deployment? How would you design a manual approval gate that doesn't become a bottleneck? What risks does Continuous Deployment introduce that Continuous Delivery mitigates?
Question 4
Question: What is the concept of "infrastructure as code," and why is it foundational to modern DevOps practice?
Answer: Infrastructure as code (IaC) defines and manages infrastructure declaratively through version-controlled configuration files rather than manual, ad hoc provisioning through a console or CLI — enabling infrastructure changes to be code-reviewed, tested, reliably reproduced across environments, and easily audited or reverted, just like application code.
Explanation: A foundational DevOps concept underlying most modern infrastructure management practice, essential vocabulary for virtually any DevOps role.
Real-World Example: A team using Terraform to define their complete cloud infrastructure can reliably reproduce an identical staging environment and review infrastructure changes through the same pull-request process used for application code, rather than relying on undocumented, error-prone manual console configuration.
Common Mistakes: Manually provisioning infrastructure through a cloud console "just this once" alongside an otherwise IaC-managed environment, causing configuration drift that IaC tooling doesn't know about and can't reliably reconcile.
Follow-up Questions: What is configuration drift, and how would you detect and resolve it? How would you handle managing secrets securely within an IaC workflow? What's the difference between declarative and imperative approaches to infrastructure automation?
Question 5
Question: What is the blameless postmortem practice, and why is it considered important in DevOps culture?
Answer: A blameless postmortem investigates an incident by focusing on systemic contributing factors (process gaps, missing safeguards, unclear ownership) rather than assigning individual blame, on the premise that people generally act reasonably given the information and pressures they had at the time — this encourages honest, detailed incident reporting and genuine learning, rather than defensive behavior or hidden near-misses that come from a blame-oriented culture.
Explanation: A very commonly tested cultural practice question, testing whether a candidate understands why psychological safety is actually a practical engineering concern, not just a soft HR consideration.
Real-World Example: A team practicing blameless postmortems after a deployment-caused outage focuses on "why did our testing process not catch this, and why didn't our monitoring alert us sooner" rather than "who deployed the bad change," leading to concrete process improvements rather than a chilling effect on future incident reporting.
Common Mistakes: Conducting a postmortem that technically avoids naming individuals but still implicitly assigns blame through its framing, undermining the actual psychological safety the practice is meant to create.
Follow-up Questions: How would you structure a postmortem meeting to keep it genuinely blameless in practice, not just in name? How do you ensure postmortem action items actually get followed through on, rather than being written down and forgotten? What would you do if you noticed a team member was reluctant to report a near-miss due to fear of blame?
Question 6
Question: What's the difference between the "shift-left" and "shift-right" approaches in DevOps practice?
Answer: Shift-left means moving activities like testing, security scanning, and quality checks earlier in the development lifecycle (closer to the coding stage), catching issues sooner when they're cheaper and easier to fix. Shift-right means extending quality and monitoring practices into production itself — things like canary releases, feature flags, and production observability — recognizing that some issues can only be found under genuine real-world conditions.
Explanation: A commonly tested DevOps philosophy question, testing whether a candidate understands these as complementary strategies rather than a strict either/or choice.
Real-World Example: A team shifting left might add automated security scanning directly into their CI pipeline (catching vulnerabilities before merge), while shifting right might mean using canary deployments and feature flags to safely validate a change against real production traffic before a full rollout.
Common Mistakes: Treating shift-left and shift-right as competing philosophies rather than complementary practices that address different, both genuinely necessary, parts of the software delivery lifecycle.
Follow-up Questions: Can you give a specific example of a practice that exemplifies shift-right testing? How would you balance investment between shift-left and shift-right practices for a team with limited time? What risks does over-reliance on shift-right testing alone introduce?
Question 7
Question: What is the role of a DevOps engineer, and how does it differ from a Site Reliability Engineer (SRE)?
Answer: A DevOps engineer typically focuses broadly on building and maintaining CI/CD pipelines, infrastructure automation, and enabling development teams to ship and operate software efficiently. An SRE, a related but distinct discipline originating at Google, applies software engineering practices specifically to operations problems, often with a more explicit focus on defined reliability targets (SLIs/SLOs/error budgets) and a more rigorous, quantitative approach to balancing reliability against feature velocity — in practice, the two roles overlap significantly and the exact distinction varies considerably by company.
Explanation: A commonly tested role-clarity question, testing genuine understanding of these related but distinct disciplines rather than treating the titles as pure synonyms.
Real-World Example: An SRE team might formally define a 99.9% availability SLO for a service and use the resulting "error budget" to make explicit, quantitative decisions about how much risk they can afford to take on new feature releases in a given period, a somewhat more formalized practice than many DevOps teams adopt.
Common Mistakes: Being unable to articulate any meaningful distinction between the two roles at all, suggesting a lack of awareness of SRE-specific concepts like error budgets and SLOs.
Follow-up Questions: What is an error budget, and how would you use one to make a concrete decision? How would you define an appropriate SLO for a given service? Have you worked in an organization that distinguished between these two roles — what was that distinction in practice?
Question 8
Question: What is the "you build it, you run it" principle, and what are its benefits and challenges?
Answer: This principle holds that the team that builds a service is also responsible for operating it in production (including being on-call for it), rather than handing it off to a separate operations team — benefits include faster feedback loops and stronger incentive for developers to write reliable, operable code, while challenges include the need for developers to genuinely learn operational skills and the risk of on-call burnout if not managed thoughtfully.
Explanation: A commonly tested DevOps culture question, testing whether a candidate understands both the benefits this principle is meant to deliver and its genuine, real practical challenges.
Real-World Example: Amazon popularized this principle internally, finding that developers who were personally on-call for the services they built wrote noticeably more operable, well-monitored code than when operations was handled entirely by a separate, disconnected team.
Common Mistakes: Presenting this principle as an unconditional best practice without acknowledging genuine challenges like on-call fatigue, the need for proper tooling and training, and the risk of burning out developers who weren't hired with operational responsibilities in mind.
Follow-up Questions: How would you structure an on-call rotation to avoid burnout under this model? What tooling and training would a development team need to successfully take on this responsibility? How would you handle a team that's resistant to adopting on-call responsibilities?
Question 9
Question: What is technical debt in the context of infrastructure and operations, and how would you manage it?
Answer: Operational/infrastructure technical debt refers to shortcuts or outdated practices in infrastructure, automation, or tooling that create ongoing friction or risk (like an undocumented manual deployment step, an outdated dependency with known vulnerabilities, or infrastructure that was never properly migrated to IaC) — managing it involves making this debt visible (tracked, not just informally known), and deliberately, periodically allocating time to pay it down rather than only ever adding new features.
Explanation: A commonly tested pragmatic engineering question, testing whether a candidate treats infrastructure health as an ongoing, deliberate practice rather than something addressed only reactively after it causes a serious incident.
Real-World Example: A team relying on a manual, undocumented deployment process "that only one person really understands" represents a serious form of operational technical debt — the fix isn't just documenting it, but properly automating it so the process doesn't depend on tribal knowledge held by a single individual.
Common Mistakes: Only addressing operational technical debt reactively after it directly causes a significant incident, rather than proactively tracking and periodically prioritizing it before it becomes a genuine crisis.
Follow-up Questions: How would you make the business case for investing time in paying down infrastructure technical debt to a less technical stakeholder? How would you prioritize which pieces of technical debt to address first? Can you describe a specific piece of infrastructure debt you helped address in a past role?
Question 10
Question: How would you approach introducing DevOps practices to an organization that currently has siloed development and operations teams?
Answer: Start with a small, well-scoped pilot project or team to demonstrate concrete value before attempting a broad, organization-wide rollout, focus on automating the most painful, highest-friction manual processes first (often deployment), invest in genuine cross-team collaboration and shared visibility (like shared dashboards and blameless incident reviews) rather than just introducing new tools, and be prepared for the cultural shift to take considerably longer than any purely technical migration.
Explanation: A commonly asked case-study-style question testing organizational change management skills alongside technical knowledge, particularly relevant for more senior DevOps roles.
Real-World Example: A team introducing DevOps practices might start by automating their most painful, manual, error-prone deployment process for a single service, using the resulting concrete time savings and reliability improvement as evidence to build broader organizational buy-in for expanding the practice further.
Common Mistakes: Attempting to introduce DevOps practices purely by adopting new tools (buying a CI/CD platform, for example) without addressing the underlying organizational structure and incentives that keep development and operations siloed and adversarial.
Follow-up Questions: How would you get buy-in from a skeptical operations team worried about losing control or job security? How would you measure whether your DevOps transformation pilot was actually successful? What organizational structure changes might be needed to fully support a DevOps culture long-term?
Part 2: CI/CD Pipelines
Question 11
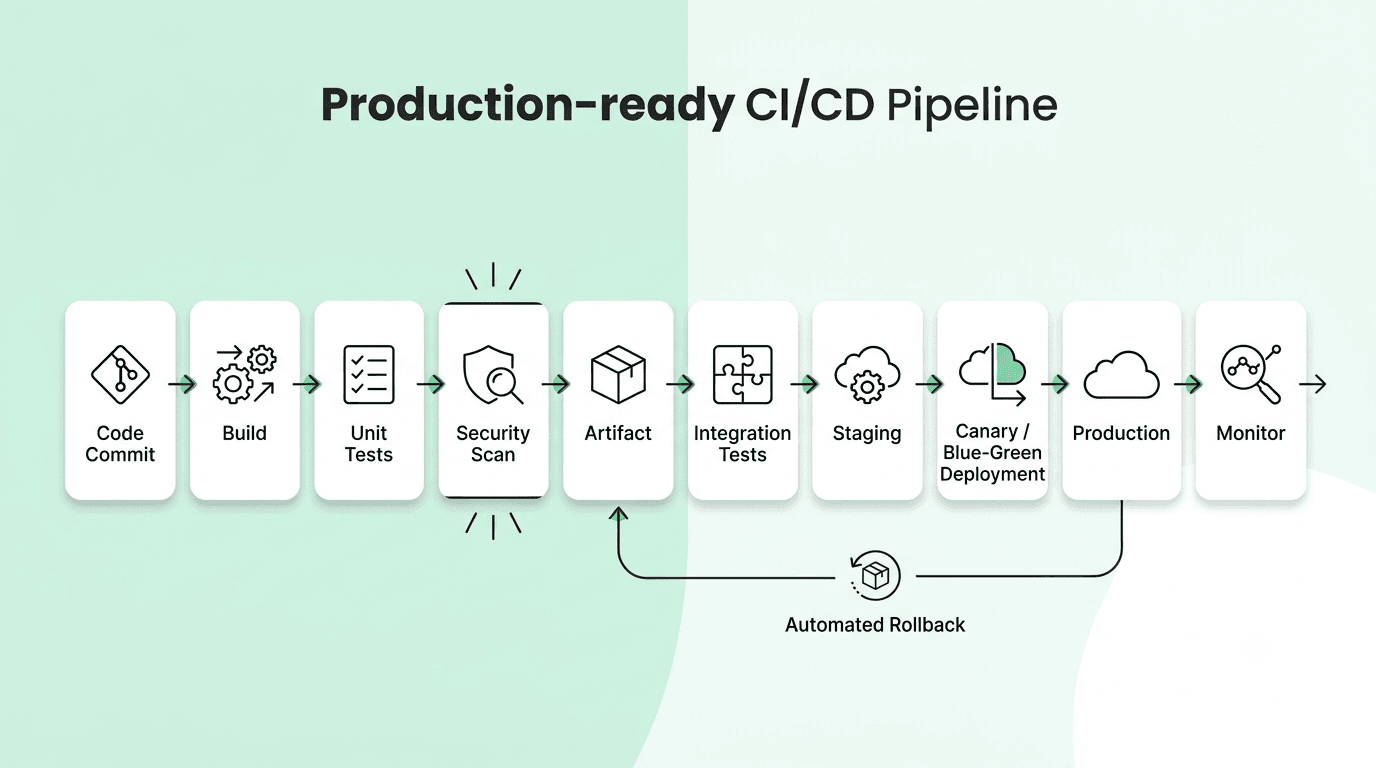
Question: How would you design a CI/CD pipeline for a typical web application from scratch?
Answer: A typical pipeline: on every pull request, run linters, unit tests, and static security scanning as required checks; on merge to main, build a deployable artifact (like a container image), run integration tests against it, and deploy automatically to staging; after staging validation (automated or manual), deploy to production, ideally using a progressive rollout strategy (canary or blue-green) with automated rollback triggers based on monitored error rates.
Explanation: One of the most commonly asked practical, hands-on DevOps questions, testing whether a candidate can design an end-to-end pipeline covering the full path from commit to production, not just describe individual pipeline stages in isolation.
Real-World Example: A typical GitHub Actions or GitLab CI pipeline for a containerized service runs tests and builds an image on every PR, pushes that image to a registry on merge, and triggers a deployment to Kubernetes via a GitOps tool like ArgoCD, which then handles the actual progressive rollout.
Common Mistakes: Designing a pipeline that only covers the build and test stages without addressing the actual deployment strategy, rollback mechanism, or how production issues introduced by a deployment would actually be detected.
Follow-up Questions: How would you handle a failing test that's flaky rather than a genuine regression? How would you design an automated rollback trigger based on production metrics? How would you handle database migrations as part of this pipeline safely?
Question 12
Question: What is the difference between a build artifact and a deployment, and why does separating them matter?
Answer: A build artifact (like a compiled binary or container image) is the immutable, versioned output of the build process, built once. A deployment is the act of taking that specific artifact and running it in a target environment. Separating these means the exact same artifact that was tested in staging is the one deployed to production, rather than rebuilding from source for each environment — eliminating the risk of environment-specific build differences causing "it worked in staging but not production" issues.
Explanation: A commonly tested, foundational CI/CD principle, testing whether a candidate understands why "build once, deploy many times" is a best practice rather than rebuilding per environment.
Real-World Example: A pipeline that builds a Docker image once, tags it with a unique version, and promotes that exact same image through staging and then production guarantees byte-for-byte consistency between what was tested and what's actually running live.
Common Mistakes: Rebuilding the application from source separately for each environment, introducing the risk that a dependency version resolves differently or a build-time environment variable differs, causing subtle, hard-to-diagnose environment-specific bugs.
Follow-up Questions: How would you version and tag build artifacts to ensure clear traceability back to the exact source commit? How would you store and manage artifacts (like using a container registry)? What would you do if you discovered a production-only bug that didn't reproduce in staging despite using the identical build artifact?
Question 13
Question: How would you handle secrets (API keys, database passwords) securely within a CI/CD pipeline?
Answer: Never hardcode secrets directly in pipeline configuration files or source code; use the CI/CD platform's built-in encrypted secrets management feature (or a dedicated secrets manager like HashiCorp Vault or AWS Secrets Manager) to inject secrets as environment variables at runtime, restrict which pipeline jobs/branches can access which specific secrets, and ensure secrets are never printed to build logs.
Explanation: A very commonly tested, fundamental security practice for CI/CD, since improperly handled secrets in pipelines are a genuinely common and consequential real-world security incident.
Real-World Example: A pipeline accidentally echoing an environment variable containing a database password into its build logs (which may be visible to a broader team or even publicly, depending on the repository's visibility) is a very common, real-world secrets leak vector that careful pipeline design specifically guards against.
Common Mistakes: Storing a production secret directly in a pipeline configuration file committed to source control, or not restricting which branches/pipeline stages can access a sensitive production secret.
Follow-up Questions: How would you rotate a compromised secret that's been used across multiple pipeline stages and environments? How would you prevent a secret from accidentally being logged during a pipeline run? How would you handle secrets differently for a pull-request pipeline (untrusted, potentially from a fork) versus a merge-to-main pipeline?
Question 14
Question: What is a canary deployment, and how would you implement one within a CI/CD pipeline?
Answer: A canary deployment gradually shifts a small percentage of live production traffic to a new version while closely monitoring key metrics (error rate, latency), progressively increasing that percentage if metrics stay healthy, or automatically rolling back if they degrade — implemented via a load balancer or service mesh capable of weighted traffic splitting, combined with automated metric-based promotion/rollback logic in the pipeline.
Explanation: A very commonly tested deployment strategy, testing understanding of a concrete approach to reducing deployment risk beyond a simple all-at-once release.
Real-World Example: A team deploying a risky backend change might route just 5% of production traffic to the new version initially, automatically rolling back if the error rate for that 5% exceeds a defined threshold, catching a serious regression before it ever affects the majority of users.
Common Mistakes: Implementing a canary deployment without clear, automated rollback criteria, requiring a human to be actively watching metrics in real time rather than having the pipeline react automatically to a clear degradation signal.
Follow-up Questions: What specific metrics would you monitor to decide whether to promote or roll back a canary? How long would you typically let a canary run before deciding to promote it further? How does canary deployment differ from blue-green deployment, and when would you choose each?
Question 15
Question: How would you handle a flaky test that intermittently fails in your CI pipeline without a clear underlying cause?
Answer: First investigate rather than immediately disabling it — flaky tests often reveal genuine underlying issues like race conditions, improper test isolation, or reliance on real timing/network calls; if the flakiness genuinely can't be immediately resolved, quarantine the test (moving it to a separate, non-blocking suite) rather than deleting it outright, track it, and prioritize a proper fix, since silently ignoring flaky tests erodes overall trust in the test suite.
Explanation: A very commonly tested practical troubleshooting question, since flaky tests are an extremely common and genuinely damaging problem to CI/CD pipeline reliability and team trust in automated testing.
Real-World Example: A test that intermittently fails due to a race condition between an async operation and an assertion that runs before it completes is a very common real-world cause of flakiness, fixable by properly awaiting the async operation rather than adding an arbitrary sleep/delay.
Common Mistakes: Simply re-running a failing pipeline until it passes without investigating the flakiness at all, which normalizes ignoring test failures and gradually erodes the team's trust in and adherence to the test suite entirely.
Follow-up Questions: How would you track and prioritize flaky tests across a large test suite? What are common root causes of test flakiness you've encountered? How would you design your CI system to distinguish a genuinely flaky test from a real regression automatically?
Question 16
Question: What is GitOps, and how does it differ from a traditional push-based CI/CD deployment model?
Answer: GitOps uses a Git repository as the single source of truth for the desired state of infrastructure and application deployments, with a dedicated operator (like ArgoCD or Flux) continuously reconciling the actual live state to match what's declared in Git — rather than a CI pipeline directly pushing changes to the target environment, the operator pulls the desired state and applies it, providing an automatic audit trail, easy rollback (via git revert), and continuous drift detection/correction.
Explanation: A commonly tested, increasingly popular modern deployment pattern, especially relevant for Kubernetes-based environments.
Real-World Example: A team using ArgoCD with GitOps can see the exact desired state of their production Kubernetes cluster by simply reading the Git repository, and can safely roll back a bad deployment with a straightforward git revert rather than needing direct, manual cluster access.
Common Mistakes: Confusing GitOps with simply "storing configuration in Git" without the actual key differentiator — a continuously running reconciliation loop that automatically detects and corrects drift between the declared and actual state.
Follow-up Questions: How does GitOps handle drift if someone makes a manual, out-of-band change directly to the cluster? How would you handle secrets within a GitOps workflow, given secrets generally shouldn't be stored in plain text in Git? What's the difference between a push-based and pull-based deployment model, and which does GitOps use?
Question 17
Question: How would you design a pipeline to safely handle database schema migrations as part of a deployment?
Answer: Use the expand-and-contract pattern for genuinely breaking schema changes (adding new structures alongside old ones, migrating data, switching reads/writes over, and only then removing the old structure in a later, separate deployment), run migrations as a distinct, monitored pipeline step separate from application code deployment, ensure migrations are idempotent and safely re-runnable, and always have a tested rollback plan for the migration itself, not just the application code.
Explanation: A commonly tested, practically important CI/CD concern, since database migrations are one of the riskiest parts of many deployments if not handled with deliberate care.
Real-World Example: Renaming a database column in a live production system can't safely be done as a single atomic step alongside deploying new application code — the expand-and-contract pattern spreads it across multiple safe, independently-deployable steps to avoid a risky, all-at-once cutover.
Common Mistakes: Treating a database migration as just another line in a deployment script without considering that it needs its own rollback strategy independent of the application code rollback, since reverting code doesn't automatically undo a schema change.
Follow-up Questions: How would you handle a very large table migration that would otherwise lock the table for an unacceptably long period? How would you test a migration's rollback path before running it against production? How would you sequence application code deployment relative to the migration to avoid a window of incompatibility?
Question 18
Question: What is a pipeline as code, and what are the benefits of defining CI/CD pipelines this way?
Answer: Pipeline as code defines the CI/CD pipeline's stages, steps, and configuration in a version-controlled file (like a Jenkinsfile, .gitlab-ci.yml, or GitHub Actions workflow YAML) stored alongside the application code, rather than configuring the pipeline through a UI — enabling the pipeline definition to be code-reviewed, versioned, and consistently reproduced, just like application code itself.
Explanation: A foundational, very commonly tested modern CI/CD practice, testing whether a candidate has moved beyond manually clicking through a CI tool's UI to configure pipelines.
Real-World Example: A team defining their pipeline in a .gitlab-ci.yml file can review a proposed pipeline change through the same pull-request process as any application code change, and can trace exactly when and why a specific pipeline behavior changed by looking at Git history.
Common Mistakes: Manually configuring pipeline steps through a CI tool's web UI, making pipeline changes untracked, unreviewed, and difficult to reproduce consistently across projects or recover if accidentally misconfigured.
Follow-up Questions: How would you share common pipeline logic across multiple different repositories to avoid duplication? How would you test a change to your pipeline definition itself before merging it? What's the risk of a pipeline configuration change being merged without review, and how would you mitigate it?
Question 19
Question: How would you structure a CI/CD pipeline to support multiple environments (dev, staging, production) with different configurations?
Answer: Use environment-specific configuration (via environment variables, separate config files, or a templating tool) layered on top of a shared base pipeline definition, promote the exact same tested build artifact through each environment in sequence rather than rebuilding per environment, and apply progressively stricter gates as changes move toward production (fewer/faster checks for dev, more thorough validation and possibly manual approval for production).
Explanation: A very commonly asked practical pipeline design question, testing whether a candidate can properly balance consistency (same artifact everywhere) against the genuine need for environment-specific configuration.
Real-World Example: A pipeline might deploy every merge to main automatically to a dev environment, require a passing staging validation suite before promoting to staging, and require manual approval plus a passing canary analysis before promoting the same exact artifact to production.
Common Mistakes: Rebuilding the application separately for each environment with different configuration baked in at build time, reintroducing the exact "build once, deploy many times" problem that a well-designed pipeline is meant to avoid.
Follow-up Questions: How would you manage environment-specific secrets and configuration without duplicating them across many separate files? How would you prevent a developer from accidentally deploying an untested change directly to production, bypassing staging? How would you handle a hotfix that needs to reach production faster than the normal pipeline flow allows?
Question 20
Question: What is the purpose of a staging environment, and what makes a staging environment genuinely effective versus merely nominal?
Answer: A staging environment is meant to closely mirror production, allowing changes to be validated under realistic conditions before actually reaching real users — an effective staging environment matches production's infrastructure, configuration, and (ideally, with appropriate anonymization) data characteristics closely enough that issues found there are genuinely predictive of production behavior, rather than a stripped-down environment so different from production that passing staging provides little real confidence.
Explanation: A commonly tested practical question, testing whether a candidate has thought critically about staging environment fidelity, a very common real-world source of "it worked in staging" surprises.
Real-World Example: A staging environment running on much smaller infrastructure than production, or lacking the same realistic data volume, might fail to catch a performance regression that only manifests under genuine production-scale load, giving a false sense of confidence before deployment.
Common Mistakes: Allowing a staging environment to drift significantly out of sync with production's actual configuration over time, gradually eroding its usefulness as a genuinely predictive pre-production validation step.
Follow-up Questions: How would you keep a staging environment's configuration reliably in sync with production over time? How would you handle realistic test data in staging while respecting data privacy requirements? What are the limits of what a staging environment can actually catch, even when well-maintained?
Question 21
Question: How would you approach reducing a CI pipeline's total run time when it's become a bottleneck for the team?
Answer: Profile the pipeline first to identify which specific stages are actually slow, then apply targeted fixes: parallelize independent test suites or build steps, cache dependencies between runs (rather than reinstalling them every time), use incremental builds where the tooling supports it, and consider splitting a monolithic test suite to run only genuinely affected tests for smaller, more targeted changes where feasible.
Explanation: A very commonly tested practical performance question, since slow CI pipelines are a genuinely common and significant source of developer friction and reduced deployment frequency.
Real-World Example: A pipeline that reinstalls all dependencies from scratch on every single run can often see a dramatic speedup simply by properly caching the dependency installation step between runs, since most runs don't actually change the dependency list at all.
Common Mistakes: Attempting to speed up a pipeline through guesswork rather than first profiling to identify which specific stage is actually the dominant contributor to the total run time.
Follow-up Questions: How would you decide which tests are safe to parallelize versus which need to run sequentially? How would you measure the actual impact of a specific pipeline optimization you're considering? What's the tradeoff of caching dependencies too aggressively, in terms of potentially masking a genuine dependency issue?
Question 22
Question: What is a feature flag, and how does it relate to CI/CD practice?
Answer: A feature flag is a configuration mechanism allowing a feature to be toggled on or off (or rolled out to a specific subset of users) without requiring a new code deployment — this decouples the technical act of deploying code from the separate business decision of actually releasing a feature to users, enabling safer, more gradual rollouts and quick rollback of a problematic feature without an emergency code revert and redeploy.
Explanation: A commonly tested modern deployment practice, testing awareness of how mature teams decouple deployment risk from feature release risk.
Real-World Example: A new checkout flow might be deployed to production behind a feature flag initially enabled for only 5% of users, allowing the team to monitor real-world impact and quickly disable it if a problem is discovered, without needing an urgent, stressful code rollback.
Common Mistakes: Allowing feature flags to accumulate indefinitely without ever cleaning them up once a feature is fully launched or abandoned, resulting in significant unnecessary code complexity over time.
Follow-up Questions: How would you design a feature flag system to support fine-grained, percentage-based rollouts? How would you ensure feature flags get properly cleaned up once a feature is fully launched? What testing considerations arise from having multiple feature flag states active simultaneously?
Question 23
Question: How would you set up automated security scanning within a CI/CD pipeline?
Answer: Layer several types of scanning across the pipeline: static application security testing (SAST) on source code, dependency/software composition analysis (SCA) to catch known vulnerabilities in third-party libraries, container image scanning for vulnerabilities in base images and installed packages, and, ideally, dynamic application security testing (DAST) against a running staging environment — configured to fail the build (or at least flag for review) on critical findings, integrated as a required, automated part of the pipeline rather than a separate, manual, infrequent process.
Explanation: A commonly tested DevSecOps question, testing whether a candidate treats security scanning as an integrated, automated part of the pipeline rather than a bolt-on afterthought.
Real-World Example: A pipeline that runs a dependency vulnerability scanner (like Snyk or Dependabot) on every pull request catches a critical vulnerability in a newly-added library before it's ever merged, rather than discovering it only during an infrequent, separate manual security audit months later.
Common Mistakes: Treating security scanning as a periodic, manual, separate process disconnected from the regular development and deployment pipeline, allowing known vulnerabilities to sit unaddressed in production for far longer than necessary.
Follow-up Questions: How would you handle a security scan finding that's a false positive, without it becoming a recurring team annoyance that erodes trust in the scanning tool? How would you decide which severity of finding should actually block a build versus just generate a warning? How would you integrate container image scanning specifically into your build process?
Question 24
Question: How would you handle a situation where a deployment to production causes an immediate, severe issue?
Answer: Prioritize immediate mitigation over investigation — roll back to the previous known-good version (or disable the problematic feature via a flag, if available) as quickly as possible to restore service, communicate the incident status to relevant stakeholders, and only once service is restored, investigate the actual root cause thoroughly, followed by a blameless postmortem to identify what allowed the issue to reach production and how to prevent it going forward.
Explanation: A very commonly tested, practically important incident response scenario, testing whether a candidate correctly prioritizes fast mitigation over immediate deep investigation while the system is actively degraded.
Real-World Example: A team noticing a sudden error rate spike immediately after a deployment would typically trigger an automated or manual rollback first to restore service, then investigate the root cause afterward in a stable environment rather than debugging live while users are actively impacted.
Common Mistakes: Attempting to diagnose and forward-fix the root cause while the system is actively degraded and users are being actively impacted, rather than prioritizing a fast, safe rollback first.
Follow-up Questions: How would you design your pipeline to support a fast, reliable rollback? What automated safeguards (like canary analysis) could have caught this issue before it reached all users? How would you communicate this incident to non-technical stakeholders while it's still ongoing?
Question 25
Question: What is a multi-stage Docker build, and how does it relate to CI/CD pipeline efficiency?
Answer: A multi-stage Docker build uses multiple FROM statements within a single Dockerfile, allowing you to use a full-featured image with build tools and dependencies in an early stage, then copy only the final compiled artifacts into a much smaller, leaner final production image — reducing the final image size, attack surface, and pipeline build/push/pull times, since build tools and intermediate dependencies never make it into the deployed image.
Explanation: A very commonly tested practical containerization and CI/CD efficiency question, testing hands-on familiarity with an important Docker optimization technique.
Real-World Example: A Node.js application's Docker build might use a full Node image with development dependencies to build and compile assets in one stage, then copy only the resulting compiled output into a minimal, lightweight production image in the final stage, dramatically reducing the deployed image's size.
Common Mistakes: Shipping a bloated, single-stage Docker image that includes build tools and development dependencies never actually needed at runtime, unnecessarily increasing image size, pull time, and the container's overall attack surface.
Follow-up Questions: How would you further optimize Docker layer caching to speed up repeated builds in CI? What's the security benefit of a smaller final production image, beyond just size? How would you decide what belongs in the build stage versus the final runtime stage?
Part 3: Containerization & Orchestration
Question 26
Question: What is Docker, and what problem does containerization solve compared to traditional deployment approaches?
Answer: Docker packages an application together with all its dependencies and precise runtime environment into a portable, isolated container, ensuring consistent behavior across different environments and eliminating the "it works on my machine" class of problem — compared to traditional deployment (installing dependencies directly on a server), containers provide isolation, consistency, and much faster, more lightweight startup than a full virtual machine.
Explanation: A foundational, universally tested containerization question, essential vocabulary for virtually any DevOps role today.
Real-World Example: A team can package an application with a specific required runtime version and precise dependencies into a Docker image, running it identically on any developer's local machine, in CI, and in production, rather than each environment potentially having subtly different installed dependency versions.
Common Mistakes: Confusing containers with virtual machines, not understanding that containers share the host OS kernel (making them much lighter and faster to start) rather than virtualizing an entire separate OS.
Follow-up Questions: What's the fundamental architectural difference between a container and a virtual machine? How does Docker achieve process isolation without a full separate OS (hint: namespaces and cgroups)? What is a Docker image layer, and how does layer caching improve build performance?
Question 27
Question: What is the difference between a Docker image and a Docker container?
Answer: A Docker image is an immutable, read-only template containing the application code, dependencies, and runtime configuration needed to run the application — a Docker container is a running (or stopped) instance of that image, with its own writable layer on top for any runtime changes, similar to the relationship between a class and an object instance in object-oriented programming.
Explanation: A very foundational, extremely commonly tested Docker vocabulary question, testing basic conceptual clarity that underlies all further container-related discussion.
Real-World Example: You might build one single Docker image for your application and run multiple separate containers from that same image simultaneously — for example, running several replicas of the same service for load distribution, each an independent running instance of the identical underlying image.
Common Mistakes: Using the terms "image" and "container" interchangeably, which suggests unfamiliarity with basic Docker concepts.
Follow-up Questions: What happens to any data written inside a running container's writable layer when that container is deleted? How would you persist data across container restarts (hint: volumes)? How would you inspect the layers that make up a given Docker image?
Question 28
Question: What is Kubernetes, and what core problem does it solve for running containerized applications at scale?
Answer: Kubernetes is a container orchestration platform that automates the deployment, scaling, networking, and self-healing of containerized applications across a cluster of machines — solving the problem of manually managing where containers run, restarting failed containers, scaling based on load, and handling service discovery and networking between many containers, which becomes unmanageable to do by hand once an application grows beyond a small number of containers.
Explanation: A foundational, near-universally tested question for DevOps roles today, given Kubernetes's dominant position in container orchestration.
Real-World Example: A team running dozens of microservices, each needing multiple replicas for reliability, relies on Kubernetes to automatically restart a crashed container, reschedule workloads if a node fails, and scale a service's replica count up or down based on defined resource utilization thresholds — all without manual intervention.
Common Mistakes: Describing Kubernetes purely as "a way to run Docker containers" without mentioning its core value propositions around self-healing, scaling, and declarative desired-state management.
Follow-up Questions: What is a Kubernetes Pod, and why does Kubernetes use Pods rather than scheduling containers directly? How does Kubernetes' declarative model (desired state) differ from an imperative deployment approach? What happens when a node in a Kubernetes cluster fails?
Question 29
Question: What is a Kubernetes Pod, and why might a Pod contain more than one container?
Answer: A Pod is the smallest deployable unit in Kubernetes, representing one or more containers that share the same network namespace and storage volumes, always scheduled together on the same node. A Pod typically contains a single main application container, but a second "sidecar" container is sometimes included to provide supporting functionality (like a logging agent, a service mesh proxy, or a configuration reloader) that needs to run tightly coupled alongside the main container.
Explanation: A foundational Kubernetes concept, essential vocabulary underlying nearly all further Kubernetes discussion.
Real-World Example: A service mesh like Istio commonly injects a sidecar proxy container into each application Pod, intercepting and managing all network traffic to and from the main application container without requiring any changes to the application code itself.
Common Mistakes: Confusing a Pod with a container, not understanding that a Pod is a higher-level grouping that can contain multiple containers sharing network and storage.
Follow-up Questions: What happens to all containers in a Pod if one of them crashes? How do containers within the same Pod communicate with each other (hint: localhost)? What's the difference between a sidecar container and an init container?
Question 30
Question: What is a Kubernetes Deployment, and how does it manage rolling updates?
Answer: A Deployment manages a set of identical Pod replicas, ensuring the desired number are always running, and handles rolling updates by gradually replacing old Pods with new ones according to a configurable strategy (like maxSurge and maxUnavailable), keeping the application available throughout the update by never taking down too many replicas at once.
Explanation: A very commonly tested, foundational Kubernetes resource, essential for understanding how applications are actually deployed and updated on the platform.
Real-World Example: Updating a Deployment's container image triggers Kubernetes to progressively create new Pods with the updated image and terminate old ones, maintaining continuous service availability throughout the rollout rather than a disruptive all-at-once replacement.
Common Mistakes: Not understanding the relationship between a Deployment and the underlying ReplicaSet it manages, or not knowing how to configure rolling update parameters to control rollout speed and availability during the transition.
Follow-up Questions: How would you roll back a Deployment to a previous version if the new one has a problem? What's the relationship between a Deployment and a ReplicaSet? How would you configure a Deployment to ensure zero downtime during a rolling update?
Question 31
Question: What is a Kubernetes Service, and why is it needed given Pods are ephemeral?
Answer: A Service provides a stable network endpoint (a consistent IP address and DNS name) for a set of Pods, since individual Pods are ephemeral — they can be created, destroyed, and rescheduled with new IP addresses at any time — a Service uses a label selector to automatically track and load-balance traffic to whichever Pods currently match, regardless of individual Pod churn.
Explanation: A very commonly tested, foundational Kubernetes networking concept, essential for understanding how applications reliably communicate within a cluster despite constantly changing Pod IPs.
Real-World Example: A frontend service communicating with a backend API doesn't need to track individual backend Pod IPs directly — it simply sends requests to the stable Service DNS name, and Kubernetes handles routing to whichever healthy backend Pods currently exist.
Common Mistakes: Having an application attempt to communicate directly with a specific Pod's IP address rather than through a Service, which breaks the moment that Pod is rescheduled and gets a new IP.
Follow-up Questions: What's the difference between a ClusterIP, NodePort, and LoadBalancer Service type? How does a Service actually know which Pods to route traffic to (hint: label selectors)? What is a headless Service, and when would you use one?
Question 32
Question: What is the difference between a ConfigMap and a Secret in Kubernetes?
Answer: A ConfigMap stores non-sensitive configuration data (like a feature flag setting or a URL) as key-value pairs that can be injected into Pods as environment variables or mounted files. A Secret stores sensitive data (passwords, API keys, certificates) similarly, but with base64 encoding (not true encryption by default) and additional access controls — importantly, base64 encoding is not encryption, so Secrets should be combined with additional protections like encryption at rest and RBAC restrictions for genuine security.
Explanation: A very commonly tested Kubernetes configuration management question, and the base64-is-not-encryption distinction specifically is a frequently probed nuance.
Real-World Example: A database connection string's hostname might live in a ConfigMap, while the corresponding database password lives in a Secret, both injected into the application Pod as environment variables, but handled with different levels of protection.
Common Mistakes: Assuming Kubernetes Secrets are encrypted and therefore fully secure by default, without realizing that base64 encoding is trivially reversible and that genuine security requires additional measures like enabling encryption at rest for etcd.
Follow-up Questions: How would you enable encryption at rest for Kubernetes Secrets stored in etcd? Would you use a dedicated external secrets manager instead of native Kubernetes Secrets, and why? How would you restrict which Pods/service accounts can access a specific Secret?
Question 33
Question: What are Kubernetes liveness and readiness probes, and how do they differ?
Answer: A liveness probe checks whether a running container is still healthy, restarting it if the check fails. A readiness probe checks whether a container is actually ready to receive traffic, removing it from a Service's load-balancing rotation if not — these are distinct checks because a container can be alive but not yet ready (still starting up) or currently ready but later become genuinely unhealthy without necessarily needing an immediate restart.
Explanation: A very commonly tested Kubernetes reliability concept, testing whether a candidate understands the practical distinction that governs correct, resilient rolling deployments and automatic recovery.
Real-World Example: A service that's slow to establish its initial database connection at startup needs a readiness probe that fails until that connection succeeds, preventing Kubernetes from routing traffic to a Pod that's technically running but not actually ready to serve requests yet.
Common Mistakes: Using a single combined health check for both liveness and readiness, which can cause Kubernetes to unnecessarily restart a Pod that's simply still starting up, or continue routing traffic to a Pod that's alive but genuinely not ready.
Follow-up Questions: What should a readiness check actually verify — just process health, or downstream dependency health too? How would you configure the timing and threshold parameters for these probes appropriately? What's a startup probe, and when would you use one alongside liveness and readiness probes?
Question 34
Question: How would you troubleshoot a Kubernetes Pod that's stuck in a CrashLoopBackOff state?
Answer: Check the Pod's logs (kubectl logs <pod> --previous to see the crashed instance's logs), describe the Pod (kubectl describe pod <pod>) to review recent events and the exact exit code/reason, check whether the container's health checks are misconfigured and causing premature restarts, and verify the application's configuration (environment variables, mounted config/secrets) is actually correct for the environment.
Explanation: One of the most commonly asked practical Kubernetes troubleshooting questions, testing hands-on debugging methodology rather than only theoretical knowledge.
Real-World Example: A Pod crash-looping due to a missing required environment variable would typically be diagnosed quickly by checking the previous container's logs, which would show the application's own startup error message clearly indicating the missing configuration.
Common Mistakes: Only checking the current (already-restarted) container's logs rather than the crashed instance's logs via --previous, missing the actual error that caused the crash in the first place.
Follow-up Questions: What's the difference between a container exit code of 1 versus 137, and what does each typically indicate? How would you distinguish an application-level crash from a misconfigured liveness probe causing unnecessary restarts? How would you debug a Pod that crashes so quickly you can't even capture its logs in time?
Question 35
Question: What is a Kubernetes Namespace, and what is it used for?
Answer: A Namespace provides a way to divide a single Kubernetes cluster into multiple virtual, logically isolated sub-clusters, commonly used to separate environments (dev/staging/prod), separate teams, or separate applications within the same physical cluster — enabling resource quotas, RBAC permissions, and network policies to be applied at the namespace level for genuine multi-tenancy within one cluster.
Explanation: A commonly tested Kubernetes organizational concept, testing understanding of how larger organizations structure multi-team or multi-environment usage of shared clusters.
Real-World Example: A company might run development, staging, and production workloads in separate namespaces within the same physical cluster, applying stricter RBAC and resource quotas to the production namespace than to development.
Common Mistakes: Assuming Namespaces provide the same level of strong isolation as entirely separate clusters, when in reality certain resources (like nodes) are still shared across namespaces, and namespace isolation alone doesn't guarantee full security isolation without additional network policies.
Follow-up Questions: What Kubernetes resources are cluster-scoped rather than namespace-scoped? How would you set resource quotas to prevent one namespace from consuming all of a shared cluster's resources? When would you choose separate namespaces versus entirely separate clusters for isolation?
Question 36
Question: What is a Kubernetes Horizontal Pod Autoscaler (HPA), and how does it work?
Answer: The HPA automatically adjusts the number of Pod replicas in a Deployment based on observed metrics (commonly CPU or memory utilization, or a custom metric like requests-per-second), scaling out when demand increases and scaling back in when it decreases, within a configured minimum and maximum replica range.
Explanation: A very commonly tested Kubernetes scaling concept, essential for understanding how applications handle variable traffic automatically without manual intervention.
Real-World Example: A service configured with an HPA targeting 70% average CPU utilization will automatically add more replicas during a traffic spike and scale back down during quieter periods, without requiring any manual intervention.
Common Mistakes: Not setting appropriate resource requests on the Pods being scaled, since the HPA's percentage-based CPU/memory targets are calculated relative to those requested values — without proper requests set, the HPA can't function correctly.
Follow-up Questions: What's the difference between the Horizontal Pod Autoscaler and the Cluster Autoscaler, and how do they work together? How would you configure autoscaling based on a custom application metric rather than just CPU/memory? What's the risk of setting an HPA's minimum replica count too low?
Question 37
Question: What is a Helm chart, and what problem does Helm solve for Kubernetes deployments?
Answer: Helm is a package manager for Kubernetes, and a Helm chart is a templated collection of Kubernetes manifest files bundled together with configurable values — solving the problem of managing and reusing complex, multi-resource Kubernetes application definitions, allowing the same chart to be deployed with different configuration values across multiple environments rather than duplicating and manually editing many separate YAML files.
Explanation: A commonly tested Kubernetes tooling question, testing familiarity with an extremely widely-used tool for managing Kubernetes application deployments at any meaningful scale.
Real-World Example: A team deploying the same application across dev, staging, and production environments can use a single Helm chart with environment-specific values files, rather than maintaining three nearly-identical but separately-edited sets of raw Kubernetes YAML manifests.
Common Mistakes: Not understanding Helm's templating mechanism, or treating a Helm chart's values.yaml as the only place configuration can be overridden, without knowing values can also be overridden directly via the command line at install/upgrade time.
Follow-up Questions: How would you version and manage a Helm chart's release history to support rollback? How would you structure a chart to support multiple environments cleanly? What's the difference between Helm and Kustomize as approaches to Kubernetes configuration management?
Question 38
Question: How would you handle persistent storage for a stateful application running in Kubernetes?
Answer: Use a PersistentVolume (the actual underlying storage resource) and a PersistentVolumeClaim (a Pod's request for that storage), typically provisioned dynamically via a StorageClass that automatically creates appropriate cloud storage (like an AWS EBS volume) on demand — for applications needing stable network identity and storage per replica (like a database cluster), use a StatefulSet rather than a regular Deployment.
Explanation: A commonly tested Kubernetes concept, testing understanding of how the platform handles the genuinely harder problem of stateful applications, which don't fit the simple stateless-replica model most Kubernetes workloads assume.
Real-World Example: Running a database cluster in Kubernetes typically uses a StatefulSet (giving each replica a stable, predictable network identity and its own dedicated PersistentVolumeClaim) rather than a standard Deployment, which doesn't guarantee stable identity or storage per replica.
Common Mistakes: Attempting to run a genuinely stateful application (like a database) using a regular Deployment rather than a StatefulSet, leading to problems with replica identity and storage association during scaling or rescheduling events.
Follow-up Questions: What's the difference between a Deployment and a StatefulSet in terms of Pod naming and storage handling? How would you handle a StorageClass's reclaim policy to control what happens to storage after a PersistentVolumeClaim is deleted? Would you actually recommend running a production database directly in Kubernetes, or using a managed cloud database service instead — why?
Question 39
Question: What is a Kubernetes Ingress, and how does it differ from a Service of type LoadBalancer?
Answer: An Ingress manages external HTTP/HTTPS access to services within a cluster, providing routing rules based on hostname or URL path, TLS termination, and typically requiring only one single external load balancer for potentially many different services — a Service of type LoadBalancer instead provisions a separate, dedicated external load balancer per service, which is simpler for a single service but considerably more expensive and harder to manage at scale with many services.
Explanation: A commonly tested Kubernetes networking concept, testing understanding of the more sophisticated, cost-effective routing layer typically used for real-world HTTP-based applications.
Real-World Example: A cluster running dozens of microservices, each needing external HTTP access, typically uses a single Ingress controller with routing rules directing traffic to the correct backend service based on hostname or path, rather than provisioning dozens of separate, costly cloud load balancers.
Common Mistakes: Using a separate LoadBalancer-type Service for every individual HTTP service in a cluster, unnecessarily incurring significant additional cloud cost and operational complexity compared to a single, well-configured Ingress.
Follow-up Questions: What is an Ingress controller, and why is Ingress itself just a specification requiring a controller implementation (like NGINX or Traefik) to actually function? How would you configure TLS termination at the Ingress layer? What's the difference between Ingress and the newer Gateway API?
Question 40
Question: How would you approach setting appropriate resource requests and limits for a Kubernetes workload?
Answer: Set resource requests based on the application's genuinely observed typical usage (informing the scheduler how much to reserve, and what the HPA's percentage-based targets are calculated against), and set limits based on the maximum the application should ever be allowed to consume (preventing one misbehaving Pod from starving others on the same node) — determined through load testing and monitoring actual usage patterns rather than guessing, since setting requests too low risks resource contention while setting them too high wastes cluster capacity.
Explanation: A very commonly tested practical Kubernetes operations question, since misconfigured resource requests/limits are a genuinely common real-world source of both performance problems and wasted infrastructure cost.
Real-World Example: A Pod with no memory limit set that has a memory leak can consume all available memory on its node, potentially causing other unrelated Pods on that same node to be evicted or the node itself to become unstable — a properly configured memory limit would instead cause just that one problematic Pod to be terminated (OOMKilled) and restarted.
Common Mistakes: Not setting resource requests/limits at all, or copying arbitrary values from an example without actually measuring the application's genuine real-world resource usage.
Follow-up Questions: What happens to a Pod when it exceeds its configured memory limit versus its CPU limit — why does Kubernetes handle these two differently? How would you use monitoring data to right-size resource requests and limits over time? What's a Quality of Service (QoS) class in Kubernetes, and how do resource requests/limits determine it?
Question 41
Question: What is a service mesh, and what problems does it solve that Kubernetes alone doesn't fully address?
Answer: A service mesh (like Istio or Linkerd) adds a dedicated infrastructure layer for managing service-to-service communication, typically via a sidecar proxy injected into each Pod, providing capabilities like fine-grained traffic management (canary routing, retries, circuit breaking), mutual TLS encryption between services, and detailed observability into service-to-service traffic — all without requiring changes to the application code itself.
Explanation: A more advanced, increasingly commonly tested Kubernetes ecosystem question, testing awareness of a genuinely important tool for managing complexity in larger microservices deployments.
Real-World Example: A company with dozens of interdependent microservices might adopt a service mesh specifically to get consistent, automatic mutual TLS encryption between all services and detailed request-level tracing across service boundaries, without needing to implement that logic individually within each service's own application code.
Common Mistakes: Recommending a service mesh for a small number of simple services, without acknowledging the meaningful added operational complexity and resource overhead a service mesh introduces, which often isn't justified until an application reaches genuine microservices-at-scale complexity.
Follow-up Questions: What's the resource and latency overhead cost of adding a sidecar proxy to every Pod? How would you decide whether your organization's microservices architecture genuinely justifies adopting a service mesh? How does a service mesh's mutual TLS differ from and complement TLS termination at an Ingress?
Question 42
Question: How would you debug a Kubernetes networking issue where two Pods can't communicate with each other?
Answer: Systematically verify each layer: confirm both Pods are actually running and ready, check that the Service (if used) has the correct label selector matching the target Pods, verify there's no restrictive NetworkPolicy blocking the traffic, use a debug Pod with tools like curl or nc to directly test connectivity from within the cluster, and check DNS resolution is working correctly for the Service name being used.
Explanation: A very commonly tested, practical Kubernetes networking troubleshooting question, testing systematic debugging methodology across the several layers involved in cluster networking.
Real-World Example: Two Pods that can't communicate are often found, upon investigation, to be blocked by an overly restrictive NetworkPolicy that was recently added for a different, unrelated purpose and inadvertently also blocks this legitimate traffic.
Common Mistakes: Immediately assuming the issue is a fundamental Kubernetes networking failure rather than working through the more common, mundane causes first (a NetworkPolicy, a misconfigured Service selector, or a simple application-level port mismatch).
Follow-up Questions: How would you use a temporary debug Pod to test network connectivity within a cluster? What's the difference between troubleshooting a networking issue within the same namespace versus across namespaces? How would you check whether DNS resolution is the actual root cause versus a lower-level connectivity issue?
Question 43
Question: What is the role of etcd in a Kubernetes cluster, and why is its health critical?
Answer: etcd is a distributed, consistent key-value store that serves as Kubernetes' backing store for all cluster state — every resource definition, current status, and configuration in the cluster is ultimately stored in etcd, meaning its availability and data integrity are absolutely critical, since etcd being unavailable or corrupted effectively means the entire cluster's control plane loses access to its source of truth.
Explanation: A commonly tested Kubernetes internals question, testing whether a candidate understands the architecture beneath the API server they interact with more directly, and the operational importance of properly backing it up.
Real-World Example: A cluster's control plane becoming unresponsive is very often ultimately traced back to an etcd problem (disk space exhaustion, network partition between etcd nodes, or corrupted data), making etcd health monitoring and regular backups a critical operational practice.
Common Mistakes: Not having a regular, tested etcd backup and restore process in place, leaving a cluster vulnerable to catastrophic, unrecoverable data loss if etcd becomes corrupted.
Follow-up Questions: How would you back up and restore etcd for a Kubernetes cluster? What happens to a running cluster's existing workloads if etcd becomes temporarily unavailable? How many etcd nodes would you run for a production cluster, and why does that specific number matter for quorum?
Question 44
Question: How would you approach right-sizing and cost-optimizing a Kubernetes cluster running in the cloud?
Answer: Use monitoring data to identify over-provisioned workloads (resource requests significantly higher than actual usage) and right-size them, enable cluster autoscaling to scale nodes down during low-demand periods, consider using spot/preemptible instances for fault-tolerant, interruptible workloads, and consolidate smaller workloads onto fewer, more efficiently-utilized nodes where appropriate bin-packing allows.
Explanation: A commonly tested practical cost-management question, increasingly important as Kubernetes cluster costs at scale become a significant, closely-watched line item for many organizations.
Real-World Example: A team discovering through monitoring that most of their workloads consistently use only 20% of their requested CPU can significantly reduce their cloud bill by right-sizing those requests, allowing the cluster autoscaler to run with meaningfully fewer nodes overall.
Common Mistakes: Over-provisioning resource requests "just to be safe" without ever revisiting them based on actual observed usage data, leading to significant ongoing wasted cloud spend across the fleet.
Follow-up Questions: How would you use spot instances safely for workloads that can tolerate interruption, while protecting genuinely critical workloads from them? How would you measure the actual cost savings from a specific right-sizing effort? What tools have you used to analyze and report on Kubernetes cost allocation across teams or namespaces?
Question 45
Question: What is a Kubernetes Operator, and when would you build or use one?
Answer: An Operator extends Kubernetes with custom controllers and Custom Resource Definitions (CRDs) to automate the management of a specific, often stateful, application beyond what Kubernetes' built-in resources handle natively — encoding operational knowledge (like how to properly back up, upgrade, or fail over a specific database) directly into automated, reusable Kubernetes-native tooling.
Explanation: A more advanced Kubernetes ecosystem concept, testing awareness of how Kubernetes' extensibility model enables automating genuinely complex, application-specific operational tasks.
Real-World Example: A PostgreSQL Operator can automate complex operational tasks like provisioning a new database cluster, handling failover if the primary node fails, and performing safe rolling upgrades — encoding specialized database operational knowledge into a reusable, declarative Kubernetes resource rather than requiring manual intervention for each of these tasks.
Common Mistakes: Building a custom Operator for a problem that a much simpler, existing Kubernetes resource (like a Job, CronJob, or StatefulSet) could already adequately handle, introducing unnecessary complexity.
Follow-up Questions: What's the difference between a Custom Resource Definition and the actual controller logic that acts on it? Can you give an example of a well-known, widely-used Operator you're familiar with? When would building a custom Operator genuinely be worth the development and maintenance investment versus using existing tooling?
Part 4: Infrastructure as Code
Question 46
Question: What is Terraform, and how does its declarative approach differ from an imperative scripting approach to infrastructure provisioning?
Answer: Terraform lets you declare the desired end state of your infrastructure in configuration files, and it automatically determines and executes the specific steps needed to reach that state, tracking the current state in a state file — an imperative approach instead requires you to explicitly script each individual step needed to provision or change infrastructure (create this, then modify that, then delete this other thing), which becomes considerably harder to manage reliably and idempotently as infrastructure complexity grows.
Explanation: A very foundational, extremely commonly tested IaC concept, essential vocabulary for virtually any DevOps role given Terraform's widespread industry adoption.
Real-World Example: Declaring "I want three web server instances" in Terraform lets the tool figure out whether to create, modify, or leave existing instances alone to reach that state, versus an imperative script that would need explicit logic to check current state and decide what specific actions to take.
Common Mistakes: Not understanding the purpose and importance of Terraform's state file, or attempting to manually modify infrastructure that Terraform manages, causing the actual infrastructure to drift out of sync with what Terraform's state file believes exists.
Follow-up Questions: What is Terraform state, and why is it important to store it securely and with proper locking in a team environment? What is terraform plan, and why is reviewing it before apply an important practice? How would you handle importing existing, manually-created infrastructure into Terraform management?
Question 47
Question: What is Terraform state, and how would you manage it safely in a team environment?
Answer: Terraform state is a file that tracks the mapping between your configuration and the actual real-world infrastructure resources it manages, essential for Terraform to know what currently exists and what changes are needed. In a team environment, state should be stored remotely (like in an S3 bucket with DynamoDB for locking, or Terraform Cloud) rather than locally, both to enable safe collaboration and to prevent concurrent runs from corrupting the state through simultaneous, conflicting modifications.
Explanation: A very commonly tested, critical practical Terraform concept, since improper state management is a frequent, genuinely damaging real-world source of infrastructure incidents.
Real-World Example: Two team members running terraform apply simultaneously against local state files (or unlocked remote state) can corrupt the state or create conflicting infrastructure changes — remote state with locking prevents this by ensuring only one apply can run at a time.
Common Mistakes: Storing Terraform state locally or committing it to source control (state files often contain sensitive data like resource IDs and sometimes secrets in plain text), rather than using a properly secured, locked remote backend.
Follow-up Questions: What sensitive information might end up in a Terraform state file, and how would you protect it? How would you recover from a corrupted or lost state file? What's the difference between terraform state commands and direct manipulation of the state file?
Question 48
Question: How would you structure a Terraform codebase for a project with multiple environments (dev, staging, production)?
Answer: Common approaches include using separate state files per environment (via Terraform workspaces or, more commonly recommended, entirely separate directories/configurations per environment) combined with reusable modules capturing shared infrastructure patterns, parameterized with environment-specific variable values — avoiding a single shared configuration and state file across all environments, which risks a mistake in one environment inadvertently affecting another.
Explanation: A very commonly asked practical Terraform architecture question, testing whether a candidate has thought through genuine multi-environment management at a level beyond a small, single-environment demo project.
Real-World Example: A well-structured Terraform project might have a shared modules/ directory defining reusable infrastructure patterns (like a standard web application stack), with separate environments/dev, environments/staging, and environments/production directories each calling those modules with environment-specific variable values and maintaining entirely separate state.
Common Mistakes: Using a single Terraform workspace or configuration to manage all environments through variable overrides alone without properly separated state, risking an accidental production change while intending to modify only a lower environment.
Follow-up Questions: What are Terraform workspaces, and what are their specific limitations for managing genuinely separate environments? How would you share a common infrastructure pattern (like a standard VPC setup) across multiple environments without duplicating code? How would you handle promoting a validated infrastructure change from staging to production safely?
Question 49
Question: What is a Terraform module, and why would you use one?
Answer: A Terraform module is a reusable, encapsulated collection of Terraform configuration representing a logical infrastructure component (like a standard VPC setup, or a web application's full infrastructure stack), accepting input variables and exposing output values, callable from multiple places to avoid duplicating the same infrastructure pattern's configuration repeatedly.
Explanation: A very commonly tested Terraform best-practices question, testing awareness of how to write maintainable, DRY (don't repeat yourself) infrastructure code at any meaningful scale.
Real-World Example: A company standardizing how every team provisions a new microservice's infrastructure (load balancer, autoscaling group, monitoring) might create a shared internal Terraform module that any team can call with a few parameters, ensuring consistency and avoiding each team reinventing the same infrastructure pattern independently.
Common Mistakes: Copy-pasting nearly identical Terraform configuration across multiple projects or environments instead of extracting the shared pattern into a properly parameterized, reusable module.
Follow-up Questions: How would you version a Terraform module to allow consumers to safely upgrade at their own pace? How would you test a Terraform module in isolation before it's used more broadly? What's the tradeoff of making a module too generic and configurable versus too rigid and specific?
Question 50
Question: How would you handle a Terraform apply that partially fails partway through, leaving infrastructure in an inconsistent state?
Answer: Terraform's state file will reflect what was actually successfully created or modified before the failure, so the first step is running terraform plan again to see exactly what Terraform now believes still needs to change to reach the desired state — investigate and fix the underlying cause of the failure (like a cloud provider API rate limit, insufficient permissions, or a genuine configuration error), and then re-run terraform apply to complete the remaining changes, since Terraform is designed to be idempotent and safely re-runnable.
Explanation: A commonly tested practical troubleshooting question, testing whether a candidate understands that a partial Terraform failure isn't a catastrophic, unrecoverable event given the tool's state-tracking design, as long as the state file itself remains intact.
Real-World Example: A terraform apply that fails partway through due to a transient cloud API error (like a brief rate limit) can typically simply be re-run once the underlying issue passes, since Terraform will accurately detect what's already been created and only attempt to create the remaining resources.
Common Mistakes: Panicking and attempting to manually fix the infrastructure directly through the cloud console after a partial failure, which can cause the actual infrastructure to drift out of sync with Terraform's state and complicate the eventual, proper resolution.
Follow-up Questions: What would you do if the state file itself became corrupted or lost during this kind of failure? How would you use terraform plan to safely preview what a re-run would actually do before committing to it? How would you design your infrastructure changes to minimize the blast radius of a partial failure?
Question 51
Question: What is configuration drift, and how would you detect and remediate it in an IaC-managed environment?
Answer: Configuration drift occurs when the actual state of live infrastructure diverges from what's declared in your IaC configuration, typically caused by manual, out-of-band changes made directly through a console or CLI rather than through the IaC tool. Detection involves regularly running a plan/diff operation (like terraform plan) to compare actual state against declared configuration, and remediation involves either updating the IaC configuration to intentionally capture a legitimate manual change, or reverting the drift by reapplying the IaC configuration to restore the intended state.
Explanation: A very commonly tested practical IaC operational concept, since configuration drift is a genuinely common real-world problem that undermines the reliability guarantees IaC is meant to provide.
Real-World Example: An engineer manually adjusting a security group rule directly through the cloud console during an urgent incident, without updating the corresponding Terraform configuration, creates drift that will either be silently reverted on the next terraform apply (potentially reintroducing the original problem) or needs to be properly captured back into the IaC configuration.
Common Mistakes: Allowing manual, out-of-band changes to become a normalized, accepted practice for "quick fixes," gradually eroding the reliability and trustworthiness of the IaC configuration as an accurate source of truth.
Follow-up Questions: How would you set up automated, regular drift detection to catch this proactively rather than discovering it only when the next planned change is applied? How would you handle a legitimate emergency situation that genuinely requires an immediate, manual change outside the normal IaC workflow? How would you build organizational discipline around always reflecting manual changes back into IaC afterward?
Question 52
Question: What is the difference between Terraform and Ansible, and when would you use each?
Answer: Terraform is primarily a declarative infrastructure provisioning tool, excelling at creating and managing cloud resources (servers, networks, databases). Ansible is primarily a configuration management and application deployment tool, excelling at configuring the software and settings on already-provisioned servers (installing packages, managing config files, deploying applications) — many real-world workflows use both together, with Terraform provisioning the underlying infrastructure and Ansible configuring what runs on it.
Explanation: A commonly tested tooling comparison question, testing whether a candidate understands these as complementary tools addressing different layers of the infrastructure lifecycle, rather than directly competing alternatives.
Real-World Example: A typical workflow might use Terraform to provision a set of virtual machines and their networking, then use Ansible to install and configure the application software, monitoring agents, and security hardening on those newly-created machines.
Common Mistakes: Treating Terraform and Ansible as interchangeable, competing tools rather than understanding they typically address genuinely different, complementary layers of the infrastructure and application lifecycle.
Follow-up Questions: Could you use Terraform's provisioners to handle configuration management instead of a separate tool like Ansible — why is that generally discouraged as a best practice? What's the difference between Ansible's agentless, push-based model and a pull-based configuration management tool like Puppet or Chef? How would you sequence a pipeline that uses both Terraform and Ansible together?
Question 53
Question: How would you test Terraform or other IaC code before applying it to production?
Answer: Layer several validation approaches: static validation and linting (terraform validate, tflint) to catch syntax and basic configuration errors, a policy-as-code tool (like Open Policy Agent or Sentinel) to enforce organizational rules (like requiring encryption on storage resources), reviewing the terraform plan output carefully before applying, and testing changes in a genuinely representative lower environment before promoting to production, ideally with some form of automated integration testing against actually-provisioned test infrastructure for critical modules.
Explanation: A commonly tested practical IaC quality assurance question, testing whether a candidate treats infrastructure code with the same testing rigor as application code, rather than only manually reviewing a plan output before applying.
Real-World Example: A team might use Open Policy Agent within their CI pipeline to automatically reject any Terraform plan that would create a publicly accessible S3 bucket without explicit, deliberate justification, catching a genuine security misconfiguration before it's ever applied.
Common Mistakes: Relying solely on manually eyeballing a terraform plan output before applying, without any automated policy enforcement or testing, which doesn't scale well as infrastructure complexity and team size grow.
Follow-up Questions: What is policy as code, and how would you use it to enforce organizational security and compliance standards automatically? How would you test a reusable Terraform module in isolation? How would you incorporate infrastructure testing into your CI/CD pipeline specifically?
Question 54
Question: What is the principle of immutable infrastructure, and how does it relate to IaC practice?
Answer: Immutable infrastructure means servers or infrastructure components are never modified after deployment — instead, any change (a configuration update, a new application version) results in provisioning entirely new infrastructure and decommissioning the old, rather than patching or updating existing resources in place. This eliminates configuration drift entirely and ensures the exact same, fully tested artifact is what's actually running, at the cost of somewhat longer deployment times compared to a quick in-place patch.
Explanation: A commonly tested infrastructure philosophy question, testing understanding of a principle that underlies much of modern cloud-native infrastructure practice, including containerization itself.
Real-World Example: Rather than SSH-ing into a running server to apply a security patch, an immutable infrastructure approach would build a new server image with the patch applied, provision new instances from that image, and terminate the old ones — guaranteeing the new instances are in a known, fully consistent state rather than one that's been incrementally patched over time.
Common Mistakes: Treating "immutable infrastructure" as purely a container-specific concept, without recognizing it as a broader infrastructure philosophy that also applies to virtual machine images and other infrastructure components.
Follow-up Questions: How does immutable infrastructure specifically help eliminate configuration drift? What are the tradeoffs of immutable infrastructure in terms of deployment speed compared to in-place patching? How would you handle a scenario requiring an urgent, emergency fix under an immutable infrastructure model?
Question 55
Question: How would you manage secrets within Terraform configuration without exposing them in state files or version control?
Answer: Never hardcode secrets directly in .tf files; instead, reference them from a dedicated secrets manager (like AWS Secrets Manager or HashiCorp Vault) using a data source that fetches the value at apply time, or pass them as sensitive input variables sourced from environment variables or a secure CI/CD secrets store — and mark sensitive variables/outputs with the sensitive = true attribute to prevent them from being displayed in plan/apply output, while being aware that they can still end up in the state file, which itself must therefore be properly secured.
Explanation: A commonly tested, practically important IaC security concern, since Terraform state files are a genuinely common and easily overlooked source of secret exposure if not handled carefully.
Real-World Example: A database password referenced via a Vault data source, rather than hardcoded directly in a Terraform configuration file, avoids that specific plaintext secret being committed to version control, though it may still appear in the state file, reinforcing why the state file itself must be stored securely and access-restricted.
Common Mistakes: Believing marking a Terraform variable as sensitive fully prevents that value from ever appearing anywhere, without realizing it can still be present in plain text within the state file itself.
Follow-up Questions: How would you further protect a Terraform state file that inevitably contains some sensitive data? How would you rotate a secret that's referenced by multiple Terraform-managed resources? What's the difference between Terraform's sensitive attribute and actually encrypting the underlying value?
Question 56
Question: How would you approach adopting infrastructure as code for an organization with a large amount of existing, manually-provisioned infrastructure?
Answer: Start incrementally rather than attempting a full, risky rewrite all at once — use import functionality (like terraform import) to bring critical, high-value existing resources under IaC management first, prioritizing infrastructure that changes frequently or is highest-risk if manually mismanaged, write and carefully verify the corresponding configuration matches actual current state before making any further changes through the tool, and establish a clear policy going forward that all new infrastructure must be provisioned exclusively through IaC.
Explanation: A commonly tested, pragmatic organizational change question, testing realistic judgment about incrementally adopting IaC in a genuinely common real-world scenario rather than proposing an unrealistic "rewrite everything at once."
Real-World Example: A team might start by importing their production database and its critical networking configuration into Terraform first (since these are high-risk, rarely-changed, and important to get right), gradually expanding IaC coverage to less critical infrastructure over subsequent months.
Common Mistakes: Attempting to import and codify an organization's entire existing infrastructure estate all at once, an approach that's rarely realistic and risks introducing errors from subtle mismatches between the generated configuration and actual existing infrastructure.
Follow-up Questions: How would you verify that an imported resource's generated Terraform configuration accurately and completely matches its actual current state? How would you get buy-in from a team accustomed to manual infrastructure management to adopt this new IaC discipline? How would you prioritize which infrastructure to bring under IaC management first?
Question 57
Question: What is the difference between Terraform's plan and apply commands, and why is reviewing the plan output an important practice?
Answer: terraform plan shows a preview of exactly what changes Terraform would make to reach the declared desired state, without actually making any changes — terraform apply executes those changes. Reviewing the plan output before applying is a critical safety practice, allowing a human (or an automated policy check) to catch an unintended or unexpectedly destructive change (like an accidental resource deletion) before it's actually executed against real infrastructure.
Explanation: A very foundational, commonly tested Terraform workflow question, testing understanding of a basic but critical safety practice.
Real-World Example: A seemingly small configuration change might unexpectedly show in the plan output that it will destroy and recreate a critical resource (rather than simply updating it in place) due to a specific attribute change requiring resource replacement — catching this in the plan review before applying avoids an unexpected, disruptive outage.
Common Mistakes: Routinely running terraform apply with auto-approval in a production context without ever carefully reviewing the plan output first, missing an opportunity to catch a genuinely destructive, unintended change before it's executed.
Follow-up Questions: What specific Terraform plan output would indicate a resource will be destroyed and recreated rather than updated in place, and why does that distinction matter? How would you incorporate an automated policy check against the plan output within a CI/CD pipeline? Would you ever use auto-approval for terraform apply, and under what specific circumstances might that be appropriate?
Question 58
Question: How would you design a disaster recovery strategy for critical infrastructure managed via IaC?
Answer: Ensure IaC configuration itself is version-controlled and backed up (typically inherent, given it lives in a Git repository), regularly test actually rebuilding critical infrastructure from the IaC configuration in an isolated environment to verify it genuinely works (not just assumed to work), maintain proper backups of any stateful data (databases, persistent volumes) separate from the infrastructure definitions themselves, and document and periodically rehearse the actual recovery procedure, including realistic recovery time objectives.
Explanation: A more senior, holistic operational question, testing whether a candidate thinks about IaC's role within a broader, genuinely tested disaster recovery plan, not just as a convenient day-to-day provisioning tool.
Real-World Example: A team that periodically runs a full disaster recovery drill — actually rebuilding their entire production environment from IaC configuration and backups in an isolated account — discovers and fixes gaps (like a manually-created resource never actually captured in IaC) well before a genuine disaster would expose them under much higher pressure.
Common Mistakes: Assuming IaC configuration alone constitutes a complete disaster recovery plan without ever actually testing a full rebuild, potentially discovering critical gaps only during a genuine, high-pressure disaster.
Follow-up Questions: How would you handle backing up and restoring stateful data (like a database) as part of this broader disaster recovery strategy? How often would you recommend running a full disaster recovery drill, and why? What would your recovery time objective and recovery point objective be for a critical production system, and how would that shape your specific strategy?
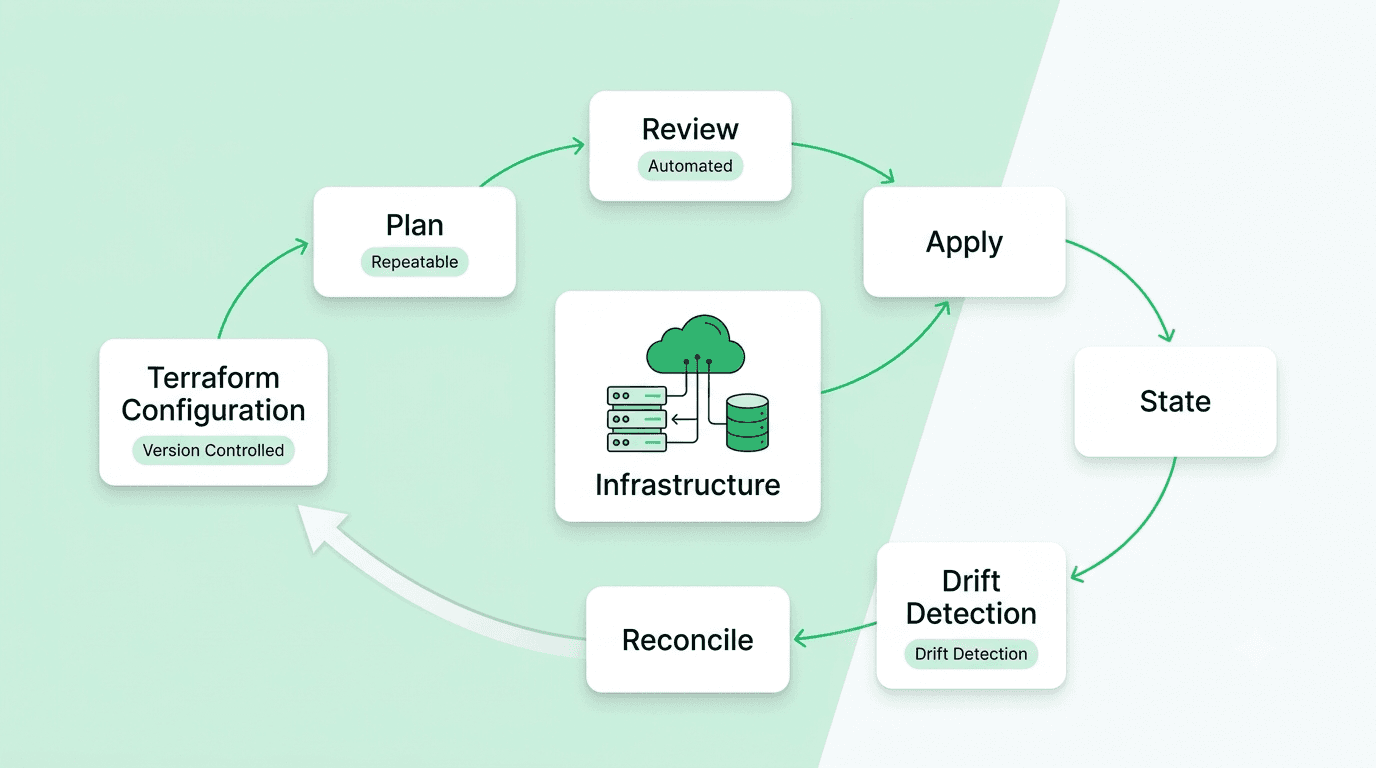
FREE TO USE
8k+ SESSIONS92% FLUENCY4.9★ RATING
Speak With Confidence
Real Conversations. Real Scenarios. Speak until it feels natural.
- Real-Time Speaking Practice
- Guided Conversation Flows
- Instant AI Feedback
Part 5: Cloud Platforms & Networking
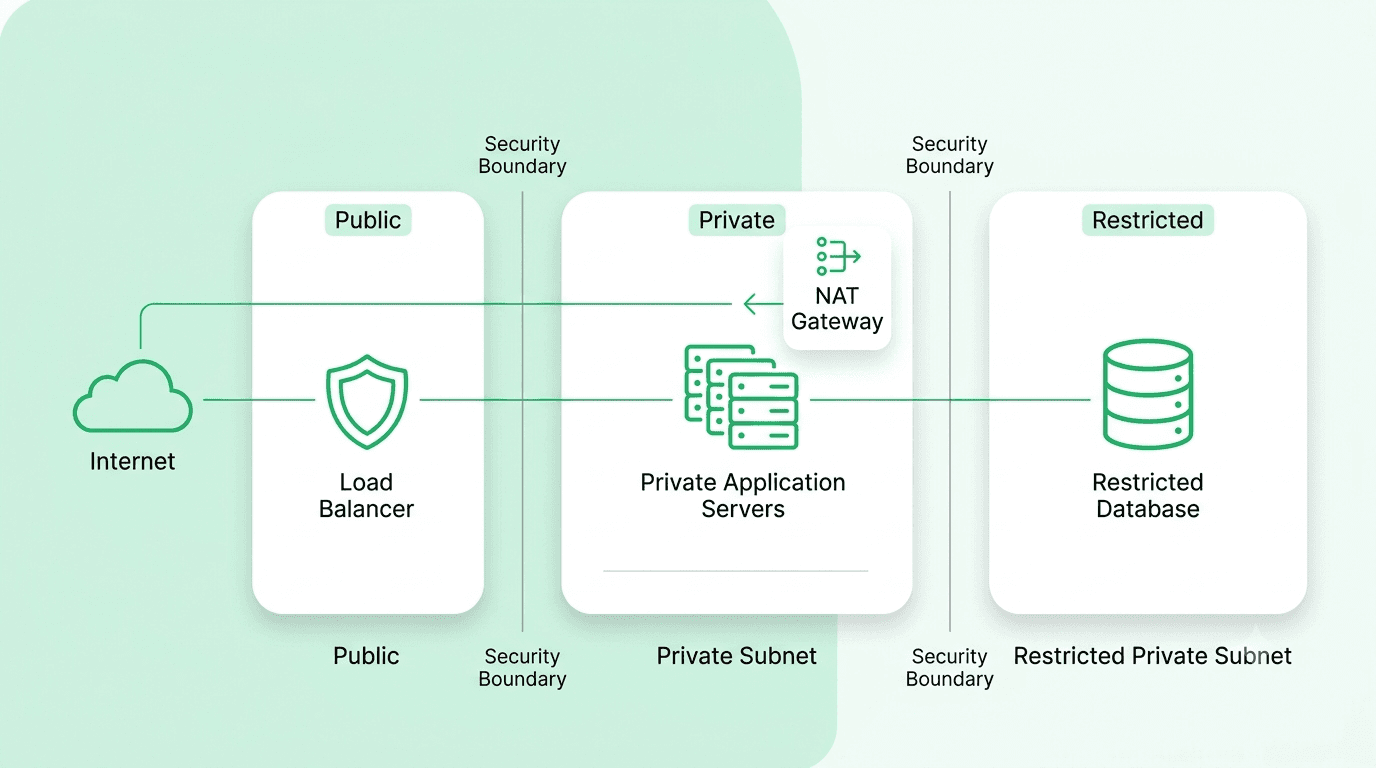
Question 59
Question: What is the difference between IaaS, PaaS, and SaaS, and how does this relate to a DevOps engineer's responsibilities?
Answer: IaaS (Infrastructure as a Service) provides raw computing resources (virtual machines, storage, networking) with the customer responsible for the OS and everything above it. PaaS (Platform as a Service) additionally manages the OS and runtime, letting developers focus purely on application code. SaaS (Software as a Service) provides a complete, ready-to-use application. A DevOps engineer's responsibilities shift significantly depending on which model is in use — far more infrastructure management on IaaS, versus more focus on application-level configuration and integration on PaaS.
Explanation: A foundational cloud computing question, testing basic vocabulary that shapes how a candidate would approach infrastructure decisions in different organizational contexts.
Real-World Example: A team using AWS EC2 (IaaS) is responsible for OS patching, security hardening, and scaling configuration themselves, while a team using AWS Elastic Beanstalk or a platform like Heroku (PaaS) offloads much of that operational burden to the platform, focusing more on application deployment and configuration.
Common Mistakes: Not being able to clearly place common real-world services (like AWS Lambda, or a managed Kubernetes service) into this spectrum, or treating the categories as more rigid than they actually are in practice.
Follow-up Questions: Where would you place a managed Kubernetes service like EKS or GKE on this spectrum? How does serverless computing (like AWS Lambda) relate to this model? How does choosing a higher level of abstraction affect a team's DevOps responsibilities and required skill set?
Question 60
Question: What is a VPC (Virtual Private Cloud), and how would you design network segmentation for a production application?
Answer: A VPC is an isolated, private virtual network within a cloud provider where you control IP address ranges, subnets, routing, and network access. A typical production design uses public subnets (for internet-facing resources like load balancers) and private subnets (for application servers and databases, not directly internet-accessible), with a NAT gateway allowing private subnet resources to initiate outbound internet connections without being directly reachable from the internet themselves.
Explanation: A very commonly tested cloud networking fundamental, essential for understanding how to properly secure and structure cloud infrastructure.
Real-World Example: A typical three-tier web application places its load balancer in a public subnet, its application servers in a private subnet (reachable only from the load balancer), and its database in an even more restricted private subnet (reachable only from the application servers), minimizing the attack surface directly exposed to the internet.
Common Mistakes: Placing sensitive resources like databases directly in a public subnet with a public IP address, unnecessarily exposing them to direct internet access and significantly increasing the attack surface.
Follow-up Questions: What's the difference between a NAT gateway and an internet gateway? How would you design network segmentation to isolate different environments or teams within the same cloud account? How would you use security groups and network ACLs together for defense in depth?
Question 61
Question: What is DNS, and how would you troubleshoot a DNS resolution issue affecting a production application?
Answer: DNS translates human-readable domain names into IP addresses through a hierarchical system of resolvers, root servers, and authoritative name servers. Troubleshooting typically starts with dig or nslookup to check what a given DNS server is actually returning for the domain, checking whether the issue is with the DNS record itself (misconfigured, wrong value, or not yet propagated), a caching/TTL issue (stale cached results), or a downstream network/routing problem unrelated to DNS at all.
Explanation: A very commonly tested networking fundamental, essential for diagnosing a genuinely common category of production issues.
Real-World Example: A newly deployed application unreachable by its intended domain name might simply have a missing or incorrect DNS record pointing to the new infrastructure, quickly diagnosable with a dig command showing the record currently resolves to the wrong (or no) IP address.
Common Mistakes: Not accounting for DNS TTL and caching when troubleshooting, potentially spending significant time investigating a problem that's actually just a stale, cached DNS result that will resolve itself once the TTL expires.
Follow-up Questions: What is DNS TTL, and how does it affect how quickly a DNS record change propagates? What's the difference between an A record, a CNAME record, and an ALIAS/ANAME record? How would you use DNS for a blue-green deployment cutover, and what are the risks of relying on DNS for fast failover given TTL/caching?
Question 62
Question: What is a load balancer, and what's the difference between Layer 4 and Layer 7 load balancing?
Answer: A load balancer distributes incoming traffic across multiple backend servers, improving reliability and enabling horizontal scaling. Layer 4 (transport layer) load balancing routes based purely on IP address and port, without inspecting the actual content of the traffic — faster and protocol-agnostic. Layer 7 (application layer) load balancing inspects the actual HTTP request content (like the URL path or headers), enabling more sophisticated routing decisions (like routing based on URL path to different backend services) at the cost of somewhat more processing overhead.
Explanation: A foundational networking concept, directly applicable to real production system design and highly relevant to any DevOps role's understanding of how scaled applications actually work.
Real-World Example: An application load balancer (Layer 7) can route /api/* requests to a backend API service and /static/* requests to a static content service, a level of routing sophistication a simpler Layer 4 load balancer can't provide.
Common Mistakes: Not knowing when a simpler, faster Layer 4 load balancer would actually be more appropriate than a Layer 7 one, given not every use case genuinely needs application-level routing intelligence.
Follow-up Questions: How would a load balancer detect and route around an unhealthy backend server? What's SSL/TLS termination, and at which layer does it typically happen? How would you achieve session stickiness with a load balancer, and what are the tradeoffs of doing so?
Question 63
Question: How would you design a highly available, multi-region architecture for a critical application?
Answer: Deploy the application redundantly across multiple geographically separate regions, use a global load balancing or DNS-based routing solution to direct traffic to the nearest or healthiest region, replicate data across regions with an appropriate consistency model for the application's needs, and design automated failover so traffic can be redirected away from a failed region without requiring manual intervention.
Explanation: A commonly tested, more advanced infrastructure resilience question, testing understanding of the real complexity involved in achieving genuine high availability beyond a single-region deployment.
Real-World Example: A globally-distributed application might use a service like AWS Route 53 with health-check-based routing to automatically direct traffic away from a region experiencing an outage, while a data replication strategy ensures user data remains available (with an appropriate consistency tradeoff) even during a regional failure.
Common Mistakes: Designing multi-region redundancy for the application/compute layer while neglecting to properly address the significantly harder problem of multi-region data replication and consistency.
Follow-up Questions: How would you handle data consistency across regions given the inherent network latency between them? How would you test that your automated regional failover actually works correctly, without waiting for a genuine disaster? What's the cost tradeoff of running fully active-active across multiple regions versus an active-passive disaster recovery setup?
Question 64
Question: What is a CDN, and how does it improve application performance and resilience?
Answer: A Content Delivery Network caches content on geographically distributed edge servers, serving users from the nearest location to reduce latency, offload the origin server, and improve resilience against traffic spikes or certain types of attacks (like some forms of DDoS).
Explanation: A foundational, commonly tested infrastructure concept relevant to almost any web application deployment at meaningful scale.
Real-World Example: A globally-distributed user base accessing a website benefits significantly from CDN-cached static assets being served from a nearby edge location rather than a single, potentially distant origin server, dramatically reducing page load latency for users far from that origin.
Common Mistakes: Not properly configuring cache headers, leading to either serving stale content longer than intended or failing to actually benefit from CDN caching at all for content that should genuinely be cacheable.
Follow-up Questions: How would you handle cache invalidation when content changes on the origin server? What's the difference between a CDN's edge cache and browser caching? How can a CDN help mitigate certain types of DDoS attacks?
Question 65
Question: How would you approach optimizing and managing cloud infrastructure costs for a growing organization?
Answer: Use cost visibility and tagging to attribute spend accurately to specific teams/projects, right-size over-provisioned resources based on actual observed usage, use reserved instances or savings plans for predictable, steady-state workloads and spot/preemptible instances for fault-tolerant workloads, set up budget alerts to catch unexpected spend increases early, and regularly review and decommission genuinely unused resources.
Explanation: A commonly tested practical cloud operations question, increasingly important as cloud costs become a significant, closely-scrutinized budget item for most organizations.
Real-World Example: A team discovering through cost analysis that a significant portion of their spend comes from several forgotten, unused development environments left running can achieve immediate, meaningful savings simply by identifying and decommissioning them.
Common Mistakes: Not implementing consistent resource tagging, making it very difficult to actually attribute cloud spend to specific teams or projects and identify where real optimization opportunities exist.
Follow-up Questions: How would you use reserved instances or savings plans without over-committing to capacity you might not actually need long-term? How would you build a culture of cost-consciousness among engineering teams without slowing down their work? What tools have you used for cloud cost visibility and optimization?
Question 66
Question: What is the shared responsibility model in cloud computing, and why does it matter for a DevOps engineer?
Answer: The shared responsibility model defines which security and operational responsibilities belong to the cloud provider versus the customer — the provider is generally responsible for the security "of" the cloud (physical infrastructure, host virtualization), while the customer is responsible for security "in" the cloud (data, application configuration, identity/access management, network configuration) — the exact split shifts depending on the service model (IaaS versus PaaS versus SaaS).
Explanation: A commonly tested cloud security fundamental, testing whether a candidate understands that using a major cloud provider doesn't automatically mean security is entirely the provider's responsibility.
Real-World Example: A misconfigured, publicly accessible S3 bucket exposing sensitive data is squarely the customer's responsibility under the shared responsibility model, not the cloud provider's — AWS secures the underlying storage infrastructure, but the customer configures its access permissions.
Common Mistakes: Assuming that using a major cloud provider inherently means security is largely "handled" by the provider, without recognizing the significant customer-side responsibilities that remain, especially around access control and configuration.
Follow-up Questions: How does the shared responsibility model shift between IaaS, PaaS, and serverless service models? Can you give a specific real-world example of a security incident that resulted from a customer misunderstanding their responsibilities under this model? How would you audit your own organization's cloud configuration for common customer-side misconfigurations?
Question 67
Question: What is IAM (Identity and Access Management), and how would you apply the principle of least privilege in a cloud environment?
Answer: IAM controls who (or what — including automated services) can access which cloud resources and perform which actions. The principle of least privilege means granting only the minimum permissions genuinely necessary for a given role or service to perform its function, rather than broad, overly permissive access — implemented through granular, specific policies rather than assigning broad administrator access as a convenient default.
Explanation: A very commonly tested cloud security fundamental, essential given how frequently overly broad IAM permissions contribute to the severity of real-world security incidents.
Real-World Example: A CI/CD pipeline's deployment credentials should have permissions scoped specifically to deploying to its intended target resources, not broad administrator access across the entire cloud account — if those credentials were ever compromised, the resulting damage would be far more limited.
Common Mistakes: Granting broad, overly permissive IAM roles "to avoid permission errors" during initial setup, then never revisiting and tightening those permissions down to what's genuinely needed once the system is actually working.
Follow-up Questions: How would you audit existing IAM policies to identify overly broad, unused permissions? How would you handle IAM for automated services (like a CI/CD pipeline) differently than for human users? What's the difference between an IAM role and an IAM user, and why does that distinction matter for service-to-service access?
Question 68
Question: What is auto scaling, and how would you configure it appropriately for a variable-traffic web application?
Answer: Auto scaling automatically adjusts the number of running instances based on defined metrics (like CPU utilization or request count), scaling out during high demand and scaling back in during low demand — appropriate configuration involves setting sensible minimum and maximum instance counts, choosing a metric that genuinely reflects actual load, and setting scaling thresholds and cooldown periods that avoid both under-reacting to genuine spikes and over-reacting to brief, transient fluctuations.
Explanation: A very commonly tested cloud infrastructure fundamental, essential for building cost-effective, resilient infrastructure that handles variable real-world traffic patterns.
Real-World Example: An e-commerce application configured with auto scaling based on request count (rather than just raw CPU) can more accurately and responsively scale to handle a sudden traffic spike during a flash sale, since request count is often a more directly meaningful indicator of actual user-facing load than CPU alone.
Common Mistakes: Setting scaling thresholds too aggressively (reacting to brief, normal fluctuations) causing wasteful "flapping" — repeatedly scaling out and back in — rather than choosing appropriate cooldown periods and thresholds that respond to genuinely sustained changes in load.
Follow-up Questions: How would you choose an appropriate scaling metric for a workload where CPU isn't a reliable proxy for actual load? What's the risk of setting your maximum instance count too low? How would you test that your auto scaling configuration actually behaves as expected under a realistic simulated load?
Question 69
Question: How would you design a disaster recovery strategy, and what's the difference between RTO and RPO?
Answer: Recovery Time Objective (RTO) is the maximum acceptable time to restore service after a disaster; Recovery Point Objective (RPO) is the maximum acceptable amount of data loss, measured in time (how far back your most recent usable backup or replica is). A disaster recovery strategy's specific architecture (backup-and-restore, pilot light, warm standby, or full active-active multi-region) is chosen based on the business's actual required RTO and RPO for a given system, balanced against the real cost of achieving them.
Explanation: A commonly tested, foundational disaster recovery planning question, testing whether a candidate can translate business requirements into an appropriately-scoped technical architecture rather than defaulting to either an insufficient or unnecessarily over-engineered approach.
Real-World Example: A critical financial trading system might require an RTO measured in seconds and an RPO near zero, justifying a costly full active-active multi-region architecture, while an internal reporting tool might tolerate an RTO of several hours and an RPO of a day, justifying a much cheaper backup-and-restore strategy.
Common Mistakes: Designing a disaster recovery strategy without first clarifying the business's actual required RTO/RPO for the specific system, potentially over-investing in an unnecessarily elaborate solution or under-investing in genuinely critical protection.
Follow-up Questions: What's the difference between a pilot light and a warm standby disaster recovery architecture? How would you actually test whether your disaster recovery strategy meets its target RTO and RPO in practice? How would you determine an appropriate RTO/RPO for a given system by working with business stakeholders?
Question 70
Question: What is a bastion host (or jump box), and why would you use one in a cloud network architecture?
Answer: A bastion host is a hardened, specifically monitored server positioned at the boundary of a private network, acting as the sole controlled entry point for administrative access (like SSH) into otherwise private, non-internet-accessible resources — rather than exposing every individual server directly to the internet for administrative access, all access is routed and logged through this single, carefully secured chokepoint.
Explanation: A commonly tested cloud security and networking concept, testing understanding of a foundational network security pattern for controlling administrative access.
Real-World Example: Engineers needing to SSH into a private database server (with no direct internet access) would first connect to a bastion host, then hop from there to the actual private target server, ensuring all such access passes through one auditable, hardened, closely-monitored point.
Common Mistakes: Directly exposing individual private servers to the internet for administrative access "for convenience" rather than routing that access through a single, hardened, and properly monitored bastion host.
Follow-up Questions: How would you further secure a bastion host itself, given it's a particularly attractive target for an attacker? What's the difference between a traditional bastion host and a more modern approach like AWS Systems Manager Session Manager? How would you audit and log access through a bastion host for security compliance purposes?
More Blogs


Oct 22, 2026
UI/UX Designer Interview Preparation Guide: A Complete Roadmap for 2026
38 min read

