Loading...
Contents
50 Best AI Prompts Every Data Scientist Should Use in 2026
May 1, 202661 min readUpdated Oct 7, 2026
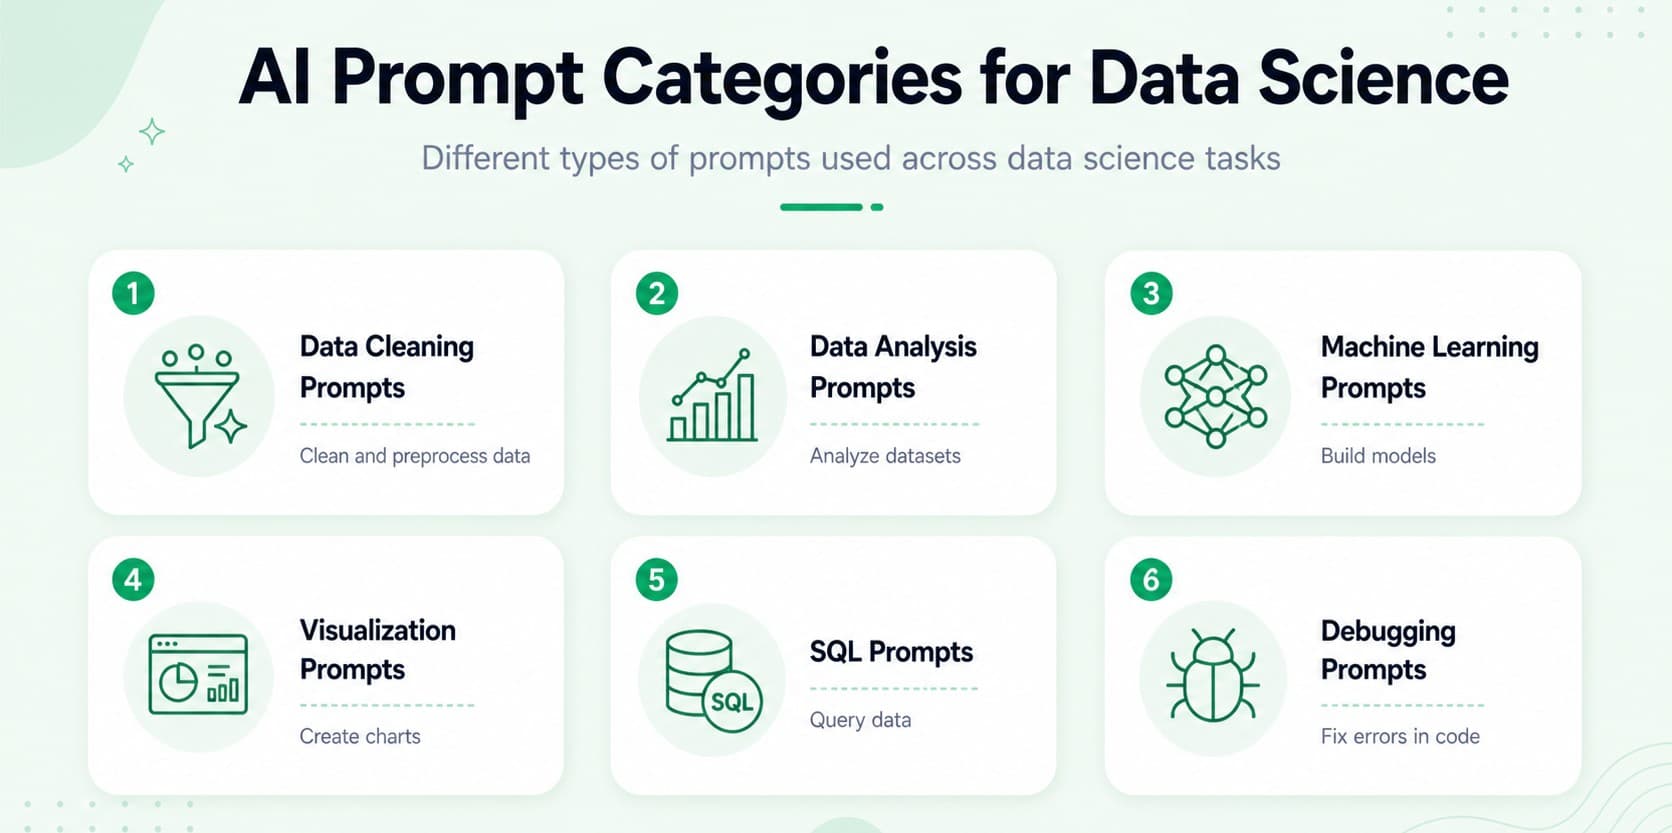
Artificial Intelligence tools are quickly changing the way data scientists work. Tasks that used to take hours like cleaning data, analyzing trends, or writing reports can now be completed much faster with the help of AI. However, the quality of results depends on the prompts you give to the AI. A good prompt tells the AI exactly what you want and how it should respond. When used correctly, AI prompts for data science can save time, improve productivity, and help you find insights faster. In this guide, we will share the 50 best AI prompts for data science that can help with data cleaning, analysis, visualization, machine learning, and reporting. These prompts are simple and ready to copy and use.
FREE TO USE
25K+ INTERVIEWS4.8★ RATING68% IMPROVEMENT
Crack Your Dream Job
Real Interviews. Real Pressure. Practice until it feels easy.
- Seamless Interview Experience
- Resume & JD Questions
- Instant Personalized Feedback
AI Prompts for Data Cleaning
Data cleaning is often the first step in any data science project. Raw datasets usually contain missing values, duplicates, or inconsistent formats. These prompts for data analysis can help automate the cleaning process. Prompt: Analyze this dataset and identify columns that contain missing values. Suggest the best methods to handle them based on data type and context. What this prompt does: Helps detect missing data and suggests ways to handle it such as mean, median, or deletion. When to use it: At the beginning of data cleaning. Prompt: Check this dataset for duplicate rows and identify how many duplicates exist. Suggest the best way to remove them without losing important data. Also provide Python code using Pandas to handle duplicates. What this prompt does: Ensures your dataset does not contain repeated records that can affect analysis. When to use it: After loading your dataset. Prompt: Analyze this dataset and identify outliers using methods like IQR or Z-score. Explain why these are outliers and suggest ways to handle them. What this prompt does: Finds extreme values and helps improve model performance. Also provide Python code to remove or cap these values. When to use it: Before training machine learning models. Prompt: Standardize the column names in this dataset by converting them to lowercase and replacing spaces with underscores. Ensure consistency across all column names. What this prompt does: Improves consistency and avoids coding errors. When to use it: At the start of data preprocessing. Prompt: Review this dataset and create a step-by-step data cleaning plan. Include handling missing values, removing duplicates, fixing data types, and detecting outliers. Provide explanations and sample Python code. What this prompt does: Provides a full roadmap for cleaning a dataset. When to use it: When starting a new project. Prompt: Analyze this dataset and check if all columns have correct data types. Suggest necessary changes and explain why correct data types are important for analysis. What this prompt does: Ensures correct data formatting. When to use it: During data preprocessing. Prompt: Identify categorical variables in this dataset and suggest encoding techniques such as label encoding or one-hot encoding. Explain when to use each method and provide Python code examples. What this prompt does: Converts text data into numerical form for machine learning. When to use it: Before model training. Prompt: Normalize or scale numerical features in this dataset using methods like Min-Max scaling or Standardization. Explain why scaling is important for machine learning models and when to apply each method. What this prompt does: Improves model performance by scaling data. When to use it: Before training ML models. Prompt: Analyze this dataset and identify inconsistent or incorrect values such as spelling errors, mixed formats, or invalid entries. Suggest ways to clean and standardize the data. What this prompt does: Improves data quality by fixing errors. When to use it: During data cleaning. Prompt: Generate Python code using Pandas to clean this dataset step-by-step. Include handling missing values, duplicates, and incorrect data types. Add comments to explain each step clearly. What this prompt does: Provides ready-to-use cleaning code. When to use it: When you want to automate cleaning.1. Identify Missing Values
2. Detect Duplicate Records
3. Handle Outliers
4. Standardize Column Names
5. Complete Data Cleaning Plan
6. Convert Data Types
7. Encode Categorical Variables
8. Normalize Data
9. Detect Inconsistencies
10. Generate Cleaning Code
AI Prompts for Data Analysis
Once the dataset is clean, the next step is to analyze the data and discover patterns. These AI prompts for data analysis help generate insights quickly. Prompt: Analyze this dataset and provide a quick summary including key statistics, important variables, and overall patterns. Keep the explanation simple and easy to understand. What this prompt does: Gives a fast overview of your data. When to use it: Right after loading the dataset. Prompt: Perform exploratory data analysis on this dataset. Identify trends, patterns, and relationships between variables. Highlight key insights and explain them in simple language. What this prompt does: Helps you understand your dataset deeply. When to use it: After cleaning the data. Prompt: Calculate correlations between variables in this dataset. Explain the strength and direction of relationships and highlight important correlations. What this prompt does: Helps identify relationships between features. When to use it: During feature selection. Prompt: Analyze this dataset and identify the most important features that impact the target variable. Explain why these features are significant. What this prompt does: Helps focus on key variables. When to use it: Before building models. Prompt: Analyze this dataset and generate business insights. Identify trends, customer behavior, and opportunities. Provide actionable recommendations Based on the findings. What this prompt does: Converts data into business value. When to use it: After completing analysis. Prompt: Analyze this dataset and detect anomalies or unusual patterns. Explain why these anomalies occur and how they can impact analysis. What this prompt does: Identifies unusual data points. When to use it: During data validation. Prompt: Based on this dataset, suggest important analytical questions that can be answered. Focus on questions that provide meaningful insights. What this prompt does: Guides your analysis direction. When to use it: Before starting analysis. Prompt: Provide statistical insights for this dataset including mean, median, variance, and distribution patterns. Explain what these statistics indicate about the data. What this prompt does: Helps understand data distribution. When to use it: During EDA. Prompt: Based on this dataset, generate possible hypotheses that can be tested. Explain how each hypothesis can be validated using data. What this prompt does: Supports data-driven decision making. When to use it: Before advanced analysis or modeling. Prompt: Analyze this dataset and generate a detailed analytical summary. Highlight key findings, trends, and patterns. Explain insights in simple language and suggest possible actions. What this prompt does: Provides a complete overview of your analysis. When to use it: At the end of your analysis process.11. Quick Dataset Summary
12. Perform EDA
13. Find Correlations
14. Identify Key Features
15. Generate Business Insights
16. Detect Anomalies
17. Suggest Questions
18. Statistical Insights
19. Hypothesis Generation
20. Summary Report
AI Prompts for Data Visualization
Visualization helps people understand complex data more easily. These prompts for data analysis can help create better charts and dashboards. Analyze this dataset and suggest the most effective charts to visualize the data. Explain why each chart is suitable and what insights it can reveal. What this prompt does: It not only suggests charts but also explains why they are useful, helping you choose better visuals. When to use it: Before creating dashboards or reports. Generate Python code using Matplotlib or Seaborn to create visualizations. Include bar charts, line graphs, and histograms with explanations. What this prompt does: Creates ready-to-use visualization code with explanations, saving a lot of time. When to use it: When you need quick and professional visualizations. Design a dashboard layout for this dataset. Suggest key metrics, charts, and sections to include. Explain how each component helps in understanding the data better.. What this prompt does: Helps you plan dashboards like a professional data analyst. When to use it: Before building dashboards in tools like Power BI or Tableau. Identify trends in this dataset and suggest the best ways to visualize them. Recommend charts such as line graphs or area charts and explain how they highlight patterns over time. What this prompt does: Focuses specifically on trend analysis and visualization. When to use it: When working with time-series or sequential data. Suggest the best visualizations to compare multiple variables in this dataset. Explain how each chart helps in understanding differences, relationships, or patterns. What this prompt does: Helps you compare different features clearly. When to use it: When analyzing relationships between variables. Suggest the best visualizations to compare multiple variables in this dataset. Explain how each chart helps in understanding differences, relationships, or patterns. What this prompt does: Creates a visual map of relationships between variables. When to use it: During feature selection and EDA. Suggest visualizations such as box plots or scatter plots to identify outliers in this dataset. Explain how these charts help in detecting extreme values. What this prompt does: Makes it easier to visually identify unusual data points. When to use it: During data cleaning and preprocessing. Create a data storytelling approach for this dataset. Suggest a sequence of visualizations and explain how to present insights in a narrative format. Make the story easy to understand for non-technical stakeholders. What this prompt does: Transforms raw data into a compelling story. When to use it: For presentations and business reports. Provide multiple visualization ideas for this dataset. Include different chart types and explain what insight each visualization can reveal. What this prompt does: Gives you creative options for presenting data. When to use it: When you want to explore different ways to present insights. Create a complete visualization strategy for this dataset. Include which charts to use, how to structure them, and how to present insights clearly. What this prompt does: Provides a full plan for presenting data effectively. When to use it: When preparing reports, dashboards, or presentations. Also suggest best practices for making the visuals clean and easy to understand.21. Suggest Best Charts
22. Generate Visualization Code
23. Design a Dashboard
24. Visualize Trends
25. Compare Variables
26. Create a Correlation Heatmap
27. Visualize Outliers
28. Create Visual Storytelling
29. Create Multiple Charts
30. Build a Visualization Plan
AI Prompts for Machine Learning
Machine learning is an important part of many data science projects. These 50 AI prompts for data science can help you build and improve models. Analyze this dataset and suggest the most suitable machine learning models. Consider whether the problem is classification, regression, or clustering. Explain why each model is appropriate and mention its advantages and limitations. What this prompt does: Helps you choose the right algorithm based on your dataset and problem type. When to use it: At the beginning of any machine learning project. Generate Python code to train a machine learning model using this dataset. Include steps such as data preprocessing, splitting the dataset, training the model, and evaluating performance. Add comments in the code to explain each step clearly. What this prompt does: Provides ready-to-use code along with explanations, making it easier for beginners. When to use it: When you want to quickly build and test a model. Explain step-by-step how to build an end-to-end machine learning model using this dataset. Include data cleaning, feature selection, model selection, training, evaluation, and optimization. Provide Python code examples and explain each step in simple terms. What this prompt does: Acts like a complete guide for building a machine learning project. When to use it: For learning or building portfolio projects. Analyze this dataset and recommend the most important features for model training. Explain how each feature impacts the target variable. Also suggest methods like correlation analysis or feature importance techniques to select features. What this prompt does: Helps improve model accuracy by selecting the right features. When to use it: Before training your model. Suggest the best evaluation metrics for this machine learning problem. Explain when to use metrics like accuracy, precision, recall, F1-score, or RMSE. Also describe how these metrics help in evaluating model performance. What this prompt does: Helps you choose the right way to measure model success. When to use it: After training your model. Generate Python code to build a classification model using this dataset. Include data preprocessing, model training, and evaluation. Also explain the results and how to interpret the output metrics. What this prompt does: Creates a complete classification pipeline with explanation. When to use it: For classification problems like spam detection or churn prediction. Explain how to detect and prevent overfitting in this machine learning model. Suggest techniques such as cross-validation, regularization, and pruning. Provide examples or code snippets where possible. What this prompt does: Helps improve model generalization and performance on new data. When to use it: When your model performs well on training data but poorly on test data. Suggest feature engineering techniques for this dataset. Include methods like encoding categorical variables, scaling numerical features, and creating new features. Explain how each technique can improve model performance. What this prompt does: Enhances your dataset to make models more accurate. When to use it: Before training the model. Suggest strategies to tune hyperparameters for this machine learning model. Include techniques like Grid Search, Random Search, or Bayesian optimization. Explain how tuning improves performance and provide example code. What this prompt does: Optimizes model performance by fine-tuning parameters. When to use it: After building a baseline model. Explain how to deploy this machine learning model into production. Include steps such as model saving, API creation, and deployment using tools like Flask or FastAPI. Also mention best practices for monitoring and updating the model. What this prompt does: Guides you in taking your model from development to real-world use. When to use it: When your model is ready to be used in applications.31. Suggest ML Models
32. Generate Model Training Code
33. Build a Prediction Model
34. Feature Selection
35. Model Evaluation Metrics
36. Classification Model Code
37. Avoid Overfitting
38. Feature Engineering Ideas
39. Hyperparameter Tuning
40. Model Deployment
FREE TO USE
8k+ SESSIONS92% FLUENCY4.9★ RATING
Speak With Confidence
Real Conversations. Real Scenarios. Speak until it feels natural.
- Real-Time Speaking Practice
- Guided Conversation Flows
- Instant AI Feedback
AI Prompts for Reporting and Insights
After completing analysis, data scientists often need to communicate insights to stakeholders. These AI prompts for data analysis help generate clear reports. Create a clear and structured data analysis report based on this dataset. Include key findings, trends, and important observations. Use simple language and organize the report with headings and bullet points. What this prompt does: Helps you quickly generate a professional report without writing everything manually. When to use it: After completing your data analysis. Explain the key insights from this dataset in simple and easy-to-understand language. Avoid technical jargon and make the explanation suitable for non-technical stakeholders. Use examples if needed to improve clarity. What this prompt does: Makes complex data insights understandable for everyone. When to use it: When presenting data to business teams or clients. Create a detailed business report based on this dataset. Include sections such as introduction, key insights, trends, visual explanations, and recommendations. Ensure the report is structured, clear, and suitable for decision-making. What this prompt does: Transforms raw data into a business-focused report with actionable insights. When to use it: For presentations or stakeholder reporting. Identify and highlight the most important insights from this dataset. Focus on trends, patterns, and any unusual observations. Explain why these insights matter. What this prompt does: Helps you quickly extract the most valuable information. When to use it: When you need a quick summary of findings. Create a presentation outline based on this dataset. Include slide titles, key points for each slide, and suggested visuals. Ensure the flow of the presentation is logical and easy to follow. What this prompt does: Helps you prepare presentations quickly and effectively. When to use it: Before creating PowerPoint or Google Slides. Explain the results of this analysis to a non-technical audience. Use simple language, real-world examples, and avoid technical terms. Make the explanation clear and engaging. What this prompt does: Bridges the gap between data science and business understanding. When to use it: When sharing insights with clients or managers. Summarize the key findings from this dataset in clear bullet points. Focus on the most important insights and keep the summary concise. What this prompt does: Creates a quick and easy-to-read summary. When to use it: For quick reviews or executive summaries. Based on this dataset, suggest practical business recommendations. Explain how each recommendation is supported by the data. Also mention possible outcomes if these recommendations are implemented. What this prompt does: Turns insights into actionable decisions. When to use it: After analyzing trends and patterns. Summarize the key findings from this dataset along with proper context. Explain what the results mean and why they are important for decision-making. Keep the explanation clear and structured. What this prompt does: Adds meaning and context to raw insights. When to use it: When writing reports or documentation. Create a compelling data story based on this dataset. Combine insights, trends, and visual ideas into a narrative format. Ensure the story is engaging, easy to follow, and suitable for presentations. What this prompt does: Transforms your analysis into a powerful storytelling format. When to use it: For presentations, case studies, or portfolio projects.41. Write a Data Analysis Report
42. Explain Insights Simply
43. Create a Business Report
44. Highlight Key Insights
45. Create a Presentation Outline
46. Explain Results to Non-Technical Audience
47. Create Bullet Point Summary
48. Suggest Business Recommendations
49. Summarize Findings
50. Create a Data Story
How AI Prompts Help Data Scientists Work Faster
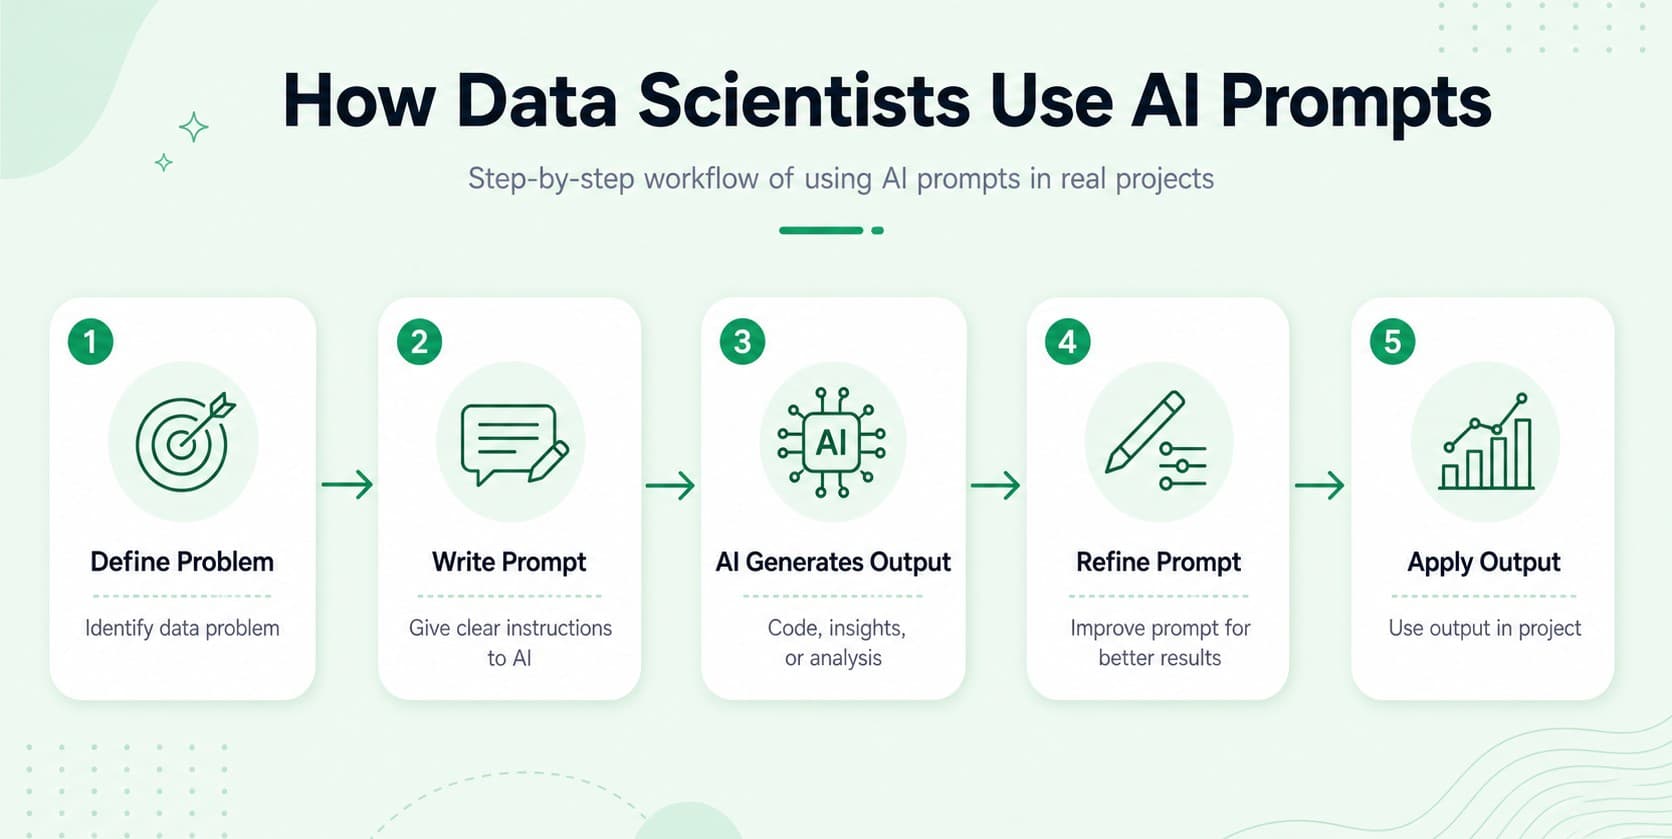
Using AI tools can significantly improve productivity for data scientists. Here are some ways these prompts help. Many data science tasks such as data cleaning or generating reports can be automated. AI tools can help create Python code for data analysis and machine learning. AI can analyze datasets and highlight patterns that might take longer to find manually. AI can help explain technical insights in simple language for stakeholders. Students and beginners can use prompts to understand datasets and learn best practices.Save time on repetitive tasks
Generate code quickly
Discover insights faster
Improve communication
Support learning for beginners
While on other hands, Ai assisted workflows are reshaping the data science roles.Read More: How AI Killed the Generalist Data Scientist
Tips for Writing Better AI Prompts for Data Science
To get better results from AI tools, follow these simple tips. Explain what type of data you are using and what you want to analyze. Tell the AI whether you want insights, visualizations, or code. This helps you understand the process better. If you need Python or SQL code, include that in the prompt. The more information you give, the better the AI response will be. Be specific about the dataset
Mention the goal clearly
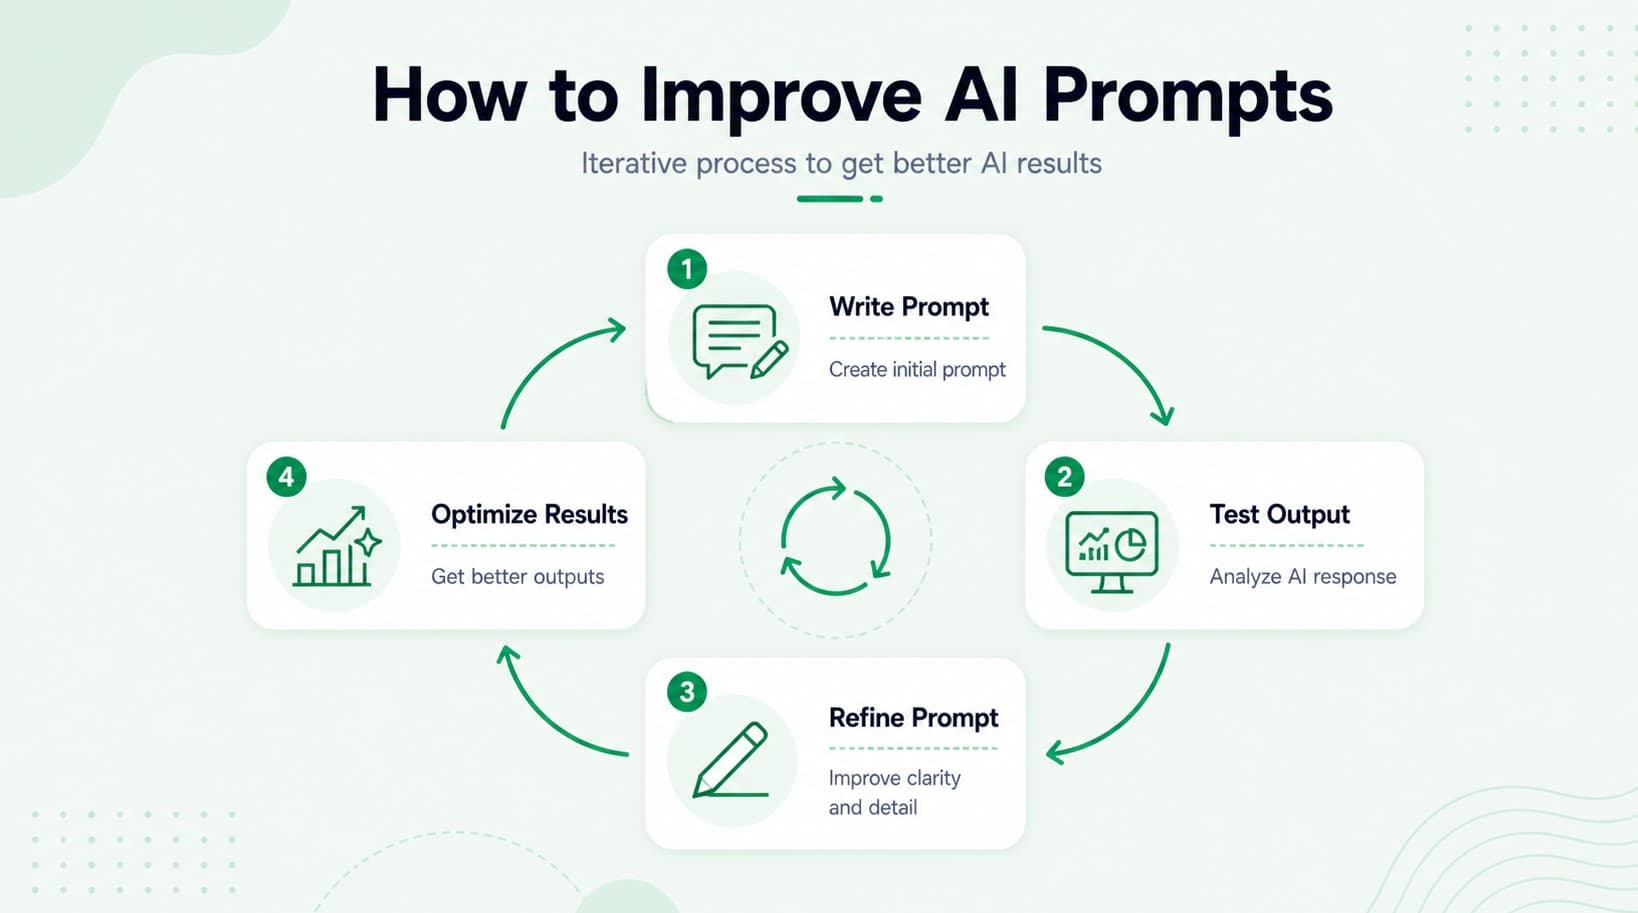
Ask for step-by-step explanations
Request code when needed
Provide context
Conclusion
Artificial Intelligence is becoming an important tool in modern data science workflows. By using the right prompts, data scientists can automate many tasks such as cleaning data, analyzing patterns, creating visualizations, and generating reports. In this guide, we shared the 50 best AI prompts for data science that can help with data cleaning, analysis, machine learning, and reporting. These prompts are practical and easy to use in AI tools. Whether you are a beginner or an experienced professional, learning how to write effective AI prompts for data analysis can make your work faster and more efficient.